Note: The Google advertisement links below may advocate political positions that this site does not endorse.
| Map | Pie | Office | Total | D | R | I | Margin | %Margin | Dem | Rep | Ind | Oth. | Dem | Rep | Ind | Other | | | | | | | | | | | | | | | | | | |
|---|
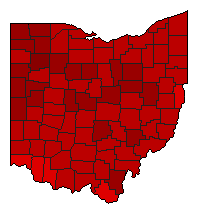
| | | Map | Pie | Initiative | Total Vote | N | | Y | Margin | %Margin | No | | Yes | Oth. | No | | Yes | |
 |  | Referendum |
2,901,534 |
2 |
0 |
1 |
1,245,592 |
42.93% |
28.54% |
0.00% |
71.46% |
0.00% |
827,971 |
0 |
2,073,563 |
0 |
 |  | Referendum |
3,076,763 |
2 |
0 |
1 |
97,357 |
3.16% |
48.42% |
0.00% |
51.58% |
0.00% |
1,489,703 |
0 |
1,587,060 |
0 |
 |  | Referendum |
3,126,027 |
1 |
0 |
2 |
881,255 |
28.19% |
64.10% |
0.00% |
35.90% |
0.00% |
2,003,641 |
0 |
1,122,386 |
0 |
|
