| Map | Pie | Office | Total | D | R | I | Margin | %Margin | Dem | Rep | Ind | Oth. | Dem | Rep | Ind | Other | | | | | | | | | | | | | | | | | | |
|---|
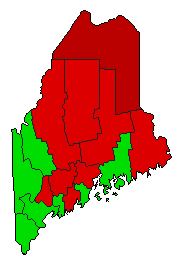
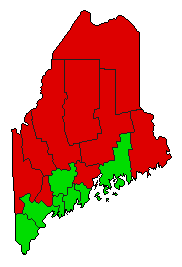
 |  | President |
747,927 |
1 |
2 |
5 |
22,142 |
2.96% |
47.83% |
44.87% |
0.25% |
7.05% |
357,735 |
335,593 |
1,887 |
52,712 |
| | | Map | Pie | Initiative | Total Vote | N | | Y | Margin | %Margin | No | | Yes | Oth. | No | | Yes | |
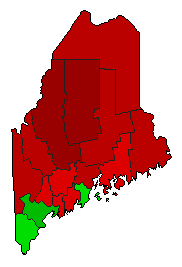
 |  | Initiative |
759,541 |
2 |
0 |
1 |
3,995 |
0.53% |
49.74% |
0.00% |
50.26% |
0.00% |
377,773 |
0 |
381,768 |
0 |
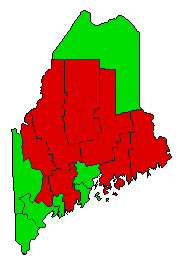
 |  | Initiative |
760,927 |
1 |
0 |
2 |
27,387 |
3.60% |
51.80% |
0.00% |
48.20% |
0.00% |
394,157 |
0 |
366,770 |
0 |
 |  | Initiative |
757,276 |
2 |
0 |
1 |
9,580 |
1.27% |
49.37% |
0.00% |
50.63% |
0.00% |
373,848 |
0 |
383,428 |
0 |
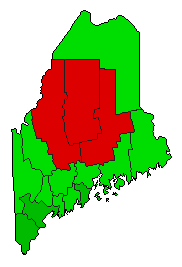 |  | Initiative |
758,378 |
2 |
0 |
1 |
83,406 |
11.00% |
44.50% |
0.00% |
55.50% |
0.00% |
337,486 |
0 |
420,892 |
0 |
 |  | Initiative |
744,894 |
2 |
0 |
1 |
31,652 |
4.25% |
47.88% |
0.00% |
52.12% |
0.00% |
356,621 |
0 |
388,273 |
0 |
|
