2016 General Election Results Comparison - Nevada
| Map | Pie | Office | Total | D | R | I | Margin | %Margin | Dem | Rep | Ind | Oth. | Dem | Rep | Ind | Other |
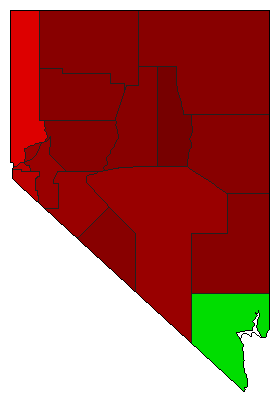
 |  | President | 1,125,385 | 1 | 2 | 0 | 27,202 | 2.42% | 47.92% | 45.50% | 0.00% | 6.58% | 539,260 | 512,058 | 0 | 74,067 |
 |  | Senator | 1,108,294 | 1 | 2 | 6 | 26,915 | 2.43% | 47.10% | 44.67% | 0.97% | 7.26% | 521,994 | 495,079 | 10,740 | 80,481 |
| Map | Pie | Initiative | Total Vote | N | Y | Margin | %Margin | No | Yes | Oth. | No | Yes | ||||
 |  | Initiative | 1,107,363 | 2 | 0 | 1 | 9,899 | 0.89% | 49.55% | 0.00% | 50.45% | 0.00% | 548,732 | 0 | 558,631 | 0 |
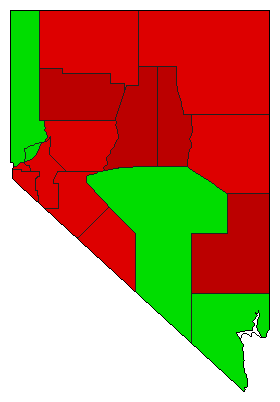 |  | Initiative | 1,106,107 | 2 | 0 | 1 | 98,819 | 8.93% | 45.53% | 0.00% | 54.47% | 0.00% | 503,644 | 0 | 602,463 | 0 |
Nevada Results for 2016
Login
© Dave Leip's Atlas of U.S. Elections, LLC 2019 All Rights Reserved
Note: The advertisement links below may advocate political positions that this site does not endorse.
Login
© Dave Leip's Atlas of U.S. Elections, LLC 2019 All Rights Reserved
Note: The advertisement links below may advocate political positions that this site does not endorse.