2016 General Election Results Comparison - New Mexico
| Map | Pie | Office | Total | D | R | I | Margin | %Margin | Dem | Rep | Ind | Oth. | Dem | Rep | Ind | Other |
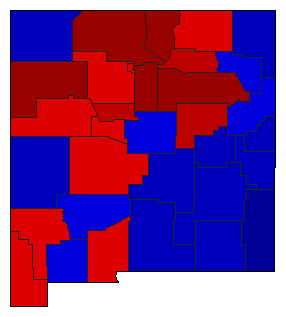
 |  | President | 798,319 | 1 | 2 | 5 | 65,567 | 8.21% | 48.26% | 40.04% | 0.73% | 10.97% | 385,234 | 319,667 | 5,825 | 87,593 |
 |  | Secretary of State | 767,960 | 1 | 2 | 0 | 98,494 | 12.83% | 56.41% | 43.59% | 0.00% | 0.00% | 433,227 | 334,733 | 0 | 0 |
New Mexico Results for 2016
Login
© Dave Leip's Atlas of U.S. Elections, LLC 2019 All Rights Reserved
Note: The advertisement links below may advocate political positions that this site does not endorse.
Login
© Dave Leip's Atlas of U.S. Elections, LLC 2019 All Rights Reserved
Note: The advertisement links below may advocate political positions that this site does not endorse.