| Map | Pie | Office | Total | D | R | I | Margin | %Margin | Dem | Rep | Ind | Oth. | Dem | Rep | Ind | Other | | | | | | | | | | | | | | | | | | |
|---|
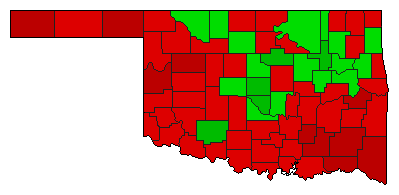
 |  | President |
1,452,992 |
2 |
1 |
0 |
528,761 |
36.39% |
28.93% |
65.32% |
0.00% |
5.75% |
420,375 |
949,136 |
0 |
83,481 |
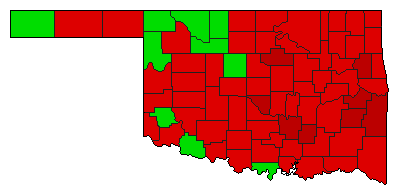
 |  | Senator |
1,448,047 |
2 |
1 |
4 |
624,981 |
43.16% |
24.58% |
67.74% |
2.79% |
4.89% |
355,911 |
980,892 |
40,405 |
70,839 |
| | | Map | Pie | Initiative | Total Vote | N | | Y | Margin | %Margin | No | | Yes | Oth. | No | | Yes | |
 |  | Referendum |
1,418,393 |
2 |
0 |
1 |
464,279 |
32.73% |
33.63% |
0.00% |
66.37% |
0.00% |
477,057 |
0 |
941,336 |
0 |
 |  | Referendum |
1,432,643 |
1 |
0 |
2 |
294,861 |
20.58% |
60.29% |
0.00% |
39.71% |
0.00% |
863,752 |
0 |
568,891 |
0 |
 |  | Referendum |
1,435,146 |
1 |
0 |
2 |
270,136 |
18.82% |
59.41% |
0.00% |
40.59% |
0.00% |
852,641 |
0 |
582,505 |
0 |
 |  | Referendum |
1,425,359 |
2 |
0 |
1 |
234,497 |
16.45% |
41.77% |
0.00% |
58.23% |
0.00% |
595,431 |
0 |
829,928 |
0 |
 |  | Referendum |
1,413,251 |
2 |
0 |
1 |
175,431 |
12.41% |
43.79% |
0.00% |
56.21% |
0.00% |
618,910 |
0 |
794,341 |
0 |
 |  | Referendum |
1,414,923 |
1 |
0 |
2 |
201,573 |
14.25% |
57.12% |
0.00% |
42.88% |
0.00% |
808,248 |
0 |
606,675 |
0 |
 |  | Referendum |
1,430,411 |
2 |
0 |
1 |
446,675 |
31.23% |
34.39% |
0.00% |
65.61% |
0.00% |
491,868 |
0 |
938,543 |
0 |
|
