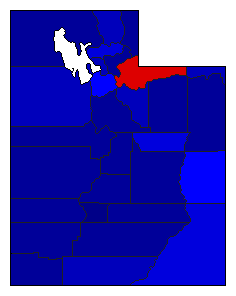
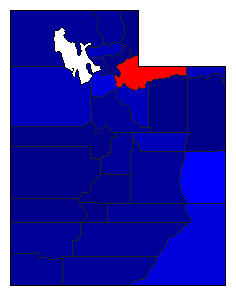
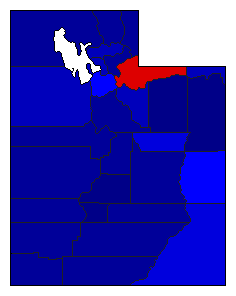
| Map | Pie | Office | Total | D | R | I | Margin | %Margin | Dem | Rep | Ind | Oth. | Dem | Rep | Ind | Other | | | | | | | | | | | | | | | | | | |
|---|
 |  | President |
1,143,732 |
2 |
1 |
3 |
204,555 |
17.88% |
27.16% |
45.05% |
21.31% |
6.48% |
310,676 |
515,231 |
243,690 |
74,135 |
 |  | Senator |
1,115,608 |
2 |
1 |
4 |
458,381 |
41.09% |
27.06% |
68.15% |
2.35% |
2.45% |
301,860 |
760,241 |
26,167 |
27,340 |
 |  | Governor |
1,125,035 |
2 |
1 |
0 |
427,501 |
38.00% |
28.74% |
66.74% |
0.00% |
4.52% |
323,349 |
750,850 |
0 |
50,836 |
 |  | State Treasurer |
1,066,087 |
2 |
1 |
3 |
314,728 |
29.52% |
31.70% |
61.23% |
7.07% |
0.00% |
337,997 |
652,725 |
75,365 |
0 |
 |  | Attorney General |
1,099,297 |
2 |
1 |
3 |
443,493 |
40.34% |
25.07% |
65.41% |
6.73% |
2.79% |
275,571 |
719,064 |
73,975 |
30,687 |
 |  | State Auditor |
1,074,992 |
2 |
1 |
3 |
350,050 |
32.56% |
30.66% |
63.23% |
6.11% |
0.00% |
329,625 |
679,675 |
65,692 |
0 |
|