Note: The Google advertisement links below may advocate political positions that this site does not endorse.
| Map | Pie | Office | Total | D | R | I | Margin | %Margin | Dem | Rep | Ind | Oth. | Dem | Rep | Ind | Other | | | | | | | | | | | | | | | | | | |
|---|
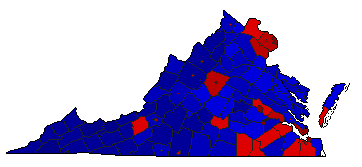
 |  | Governor |
2,614,282 |
1 |
2 |
0 |
233,444 |
8.93% |
53.90% |
44.97% |
0.00% |
1.12% |
1,409,175 |
1,175,731 |
0 |
29,376 |
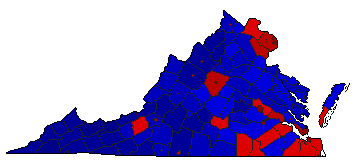
 |  | Lt. Governor |
2,595,226 |
1 |
2 |
0 |
143,742 |
5.54% |
52.72% |
47.18% |
0.00% |
0.09% |
1,368,261 |
1,224,519 |
0 |
2,446 |
 |  | Attorney General |
2,597,214 |
1 |
2 |
0 |
176,050 |
6.78% |
53.34% |
46.56% |
0.00% |
0.10% |
1,385,389 |
1,209,339 |
0 |
2,486 |
|
