| Map | Pie | Office | Total | D | R | I | Margin | %Margin | Dem | Rep | Ind | Oth. | Dem | Rep | Ind | Other | | | | | | | | | | | | | | | | | | |
|---|
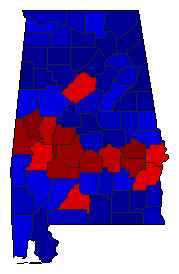
 |  | Governor |
1,719,589 |
2 |
1 |
0 |
327,962 |
19.07% |
40.39% |
59.46% |
0.00% |
0.15% |
694,495 |
1,022,457 |
0 |
2,637 |
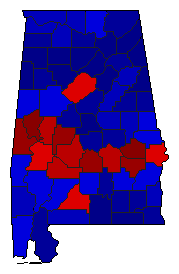
 |  | Lt. Governor |
1,705,977 |
2 |
1 |
0 |
384,928 |
22.56% |
38.69% |
61.25% |
0.00% |
0.06% |
660,013 |
1,044,941 |
0 |
1,023 |
 |  | Secretary of State |
1,692,026 |
2 |
1 |
0 |
373,888 |
22.10% |
38.92% |
61.02% |
0.00% |
0.06% |
658,537 |
1,032,425 |
0 |
1,064 |
 |  | Attorney General |
1,708,437 |
2 |
1 |
0 |
301,580 |
17.65% |
41.14% |
58.79% |
0.00% |
0.07% |
702,858 |
1,004,438 |
0 |
1,141 |
 |  | State Auditor |
1,685,507 |
2 |
1 |
0 |
352,787 |
20.93% |
39.49% |
60.42% |
0.00% |
0.08% |
665,679 |
1,018,466 |
0 |
1,362 |
| | | Map | Pie | Initiative | Total Vote | N | | Y | Margin | %Margin | No | | Yes | Oth. | No | | Yes | |
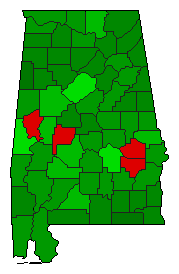 |  | Amendment |
1,527,810 |
2 |
0 |
1 |
661,544 |
43.30% |
28.35% |
0.00% |
71.65% |
0.00% |
433,133 |
0 |
1,094,677 |
0 |
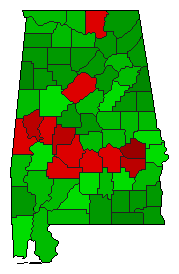 |  | Amendment |
1,552,499 |
2 |
0 |
1 |
279,623 |
18.01% |
40.99% |
0.00% |
59.01% |
0.00% |
636,438 |
0 |
916,061 |
0 |
|
