| Map | Pie | Office | Total | D | R | I | Margin | %Margin | Dem | Rep | Ind | Oth. | Dem | Rep | Ind | Other | | | | | | | | | | | | | | | | | | |
|---|
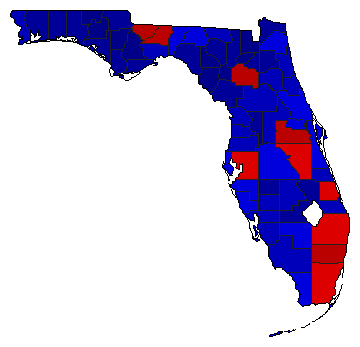
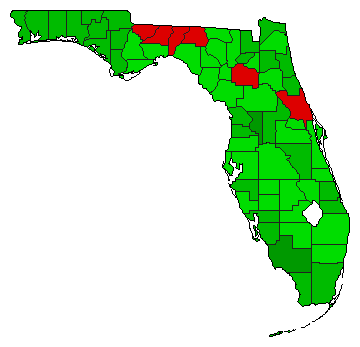
 |  | Senator |
8,190,005 |
2 |
1 |
0 |
10,033 |
0.12% |
49.93% |
50.05% |
0.00% |
0.01% |
4,089,472 |
4,099,505 |
0 |
1,028 |
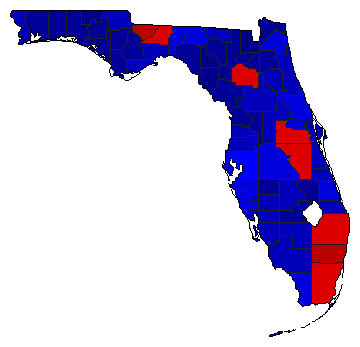
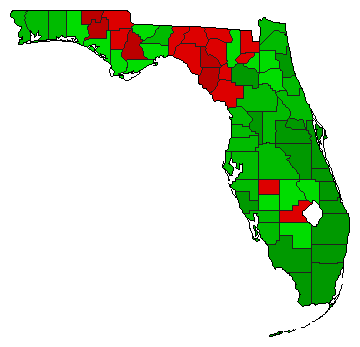
 |  | Governor |
8,220,561 |
2 |
1 |
4 |
32,463 |
0.39% |
49.19% |
49.59% |
0.30% |
0.93% |
4,043,723 |
4,076,186 |
24,310 |
76,342 |
 |  | State Treasurer |
8,025,058 |
2 |
1 |
3 |
279,681 |
3.49% |
48.26% |
51.74% |
0.00% |
0.00% |
3,872,540 |
4,152,221 |
297 |
0 |
 |  | Attorney General |
8,122,740 |
2 |
1 |
3 |
487,620 |
6.00% |
46.10% |
52.11% |
1.79% |
0.00% |
3,744,912 |
4,232,532 |
145,296 |
0 |
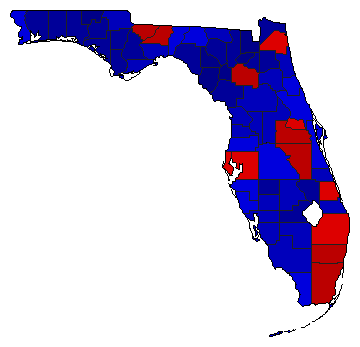 |  | Agriculture Commissioner |
8,059,155 |
1 |
2 |
0 |
6,753 |
0.08% |
50.04% |
49.96% |
0.00% |
0.00% |
4,032,954 |
4,026,201 |
0 |
0 |
| | | Map | Pie | Initiative | Total Vote | N | | Y | Margin | %Margin | No | | Yes | Oth. | No | | Yes | |
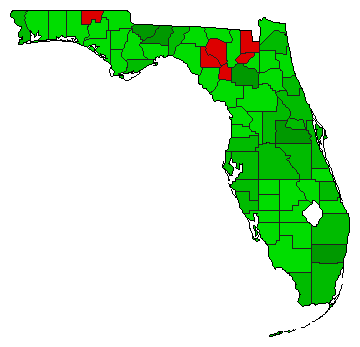 |  | Referendum |
7,977,265 |
2 |
0 |
1 |
2,320,587 |
29.09% |
35.45% |
0.00% |
64.55% |
0.00% |
2,828,339 |
0 |
5,148,926 |
0 |
 |  | Initiative |
7,854,546 |
2 |
0 |
1 |
1,266,832 |
16.13% |
41.94% |
0.00% |
58.06% |
0.00% |
3,293,857 |
0 |
4,560,689 |
0 |
 |  | Initiative |
7,830,669 |
2 |
0 |
1 |
2,984,417 |
38.11% |
30.94% |
0.00% |
69.06% |
0.00% |
2,423,126 |
0 |
5,407,543 |
0 |
|
