| Map | Pie | Office | Total | D | R | I | Margin | %Margin | Dem | Rep | Ind | Oth. | Dem | Rep | Ind | Other | | | | | | | | | | | | | | | | | | |
|---|
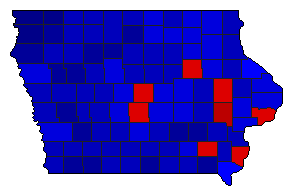
 |  | Governor |
1,327,638 |
2 |
1 |
0 |
36,289 |
2.73% |
47.53% |
50.26% |
0.00% |
2.21% |
630,986 |
667,275 |
0 |
29,377 |
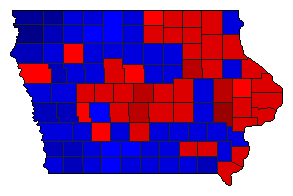
 |  | Secretary of State |
1,300,917 |
2 |
1 |
0 |
102,006 |
7.84% |
44.87% |
52.72% |
0.00% |
2.41% |
583,774 |
685,780 |
0 |
31,363 |
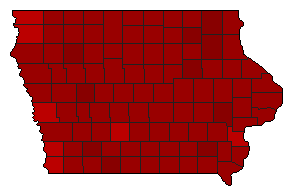
 |  | State Treasurer |
1,295,850 |
1 |
2 |
0 |
156,735 |
12.10% |
54.82% |
42.73% |
0.00% |
2.45% |
710,426 |
553,691 |
0 |
31,733 |
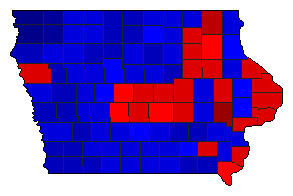
 |  | Attorney General |
1,150,899 |
1 |
0 |
0 |
618,400 |
53.73% |
76.51% |
0.00% |
0.00% |
23.49% |
880,531 |
0 |
0 |
270,368 |
 |  | State Auditor |
1,295,368 |
1 |
2 |
0 |
58,849 |
4.54% |
50.96% |
46.42% |
0.00% |
2.62% |
660,169 |
601,320 |
0 |
33,879 |
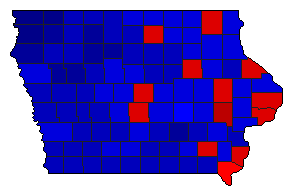 |  | Agriculture Commissioner |
1,294,030 |
2 |
1 |
0 |
48,636 |
3.76% |
46.59% |
50.35% |
0.00% |
3.06% |
602,916 |
651,552 |
0 |
39,562 |
|