| Map | Pie | Office | Total | D | R | I | Margin | %Margin | Dem | Rep | Ind | Oth. | Dem | Rep | Ind | Other | | | | | | | | | | | | | | | | | | |
|---|
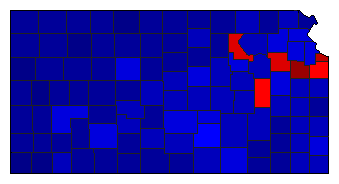
 |  | Governor |
1,054,622 |
1 |
2 |
3 |
53,479 |
5.07% |
48.03% |
42.96% |
6.50% |
2.52% |
506,509 |
453,030 |
68,498 |
26,585 |
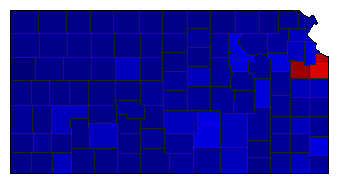
 |  | Secretary of State |
1,044,440 |
2 |
1 |
0 |
91,274 |
8.74% |
43.86% |
52.60% |
0.00% |
3.53% |
458,142 |
549,416 |
0 |
36,882 |
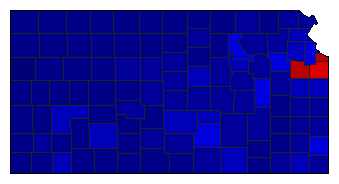
 |  | State Treasurer |
1,036,271 |
2 |
1 |
0 |
160,513 |
15.49% |
42.26% |
57.74% |
0.00% |
0.00% |
437,879 |
598,392 |
0 |
0 |
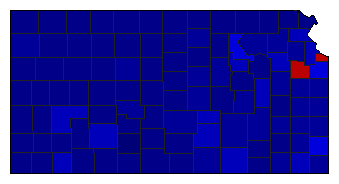
 |  | Attorney General |
1,041,725 |
2 |
1 |
0 |
187,147 |
17.97% |
41.02% |
58.98% |
0.00% |
0.00% |
427,289 |
614,436 |
0 |
0 |
 |  | Insurance Commissioner |
1,024,459 |
2 |
1 |
0 |
264,127 |
25.78% |
37.11% |
62.89% |
0.00% |
0.00% |
380,166 |
644,293 |
0 |
0 |
|
