| Map | Pie | Office | Total | D | R | I | Margin | %Margin | Dem | Rep | Ind | Oth. | Dem | Rep | Ind | Other | | | | | | | | | | | | | | | | | | |
|---|
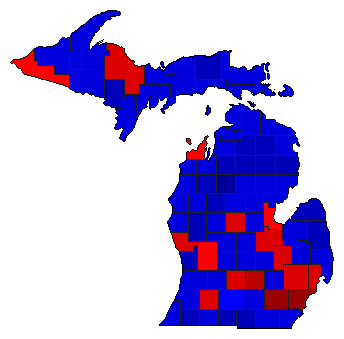
 |  | Senator |
4,237,271 |
1 |
2 |
0 |
275,660 |
6.51% |
52.26% |
45.76% |
0.00% |
1.98% |
2,214,478 |
1,938,818 |
0 |
83,975 |
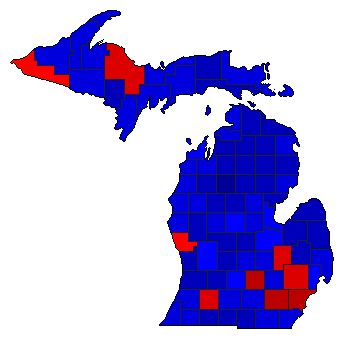
 |  | Governor |
4,250,585 |
1 |
2 |
0 |
406,659 |
9.57% |
53.31% |
43.75% |
0.00% |
2.94% |
2,266,193 |
1,859,534 |
0 |
124,858 |
 |  | Secretary of State |
4,184,026 |
1 |
2 |
3 |
373,125 |
8.92% |
52.90% |
43.98% |
1.96% |
1.17% |
2,213,243 |
1,840,118 |
81,849 |
48,816 |
 |  | Attorney General |
4,142,044 |
1 |
2 |
4 |
115,000 |
2.78% |
49.04% |
46.26% |
1.69% |
3.02% |
2,031,117 |
1,916,117 |
69,889 |
124,921 |
| | | Map | Pie | Initiative | Total Vote | N | | Y | Margin | %Margin | No | | Yes | Oth. | No | | Yes | |
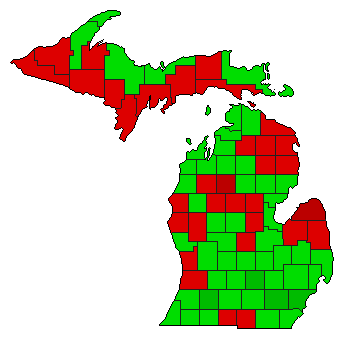 |  | Initiative |
4,198,392 |
2 |
0 |
1 |
495,034 |
11.79% |
44.10% |
0.00% |
55.90% |
0.00% |
1,851,679 |
0 |
2,346,713 |
0 |
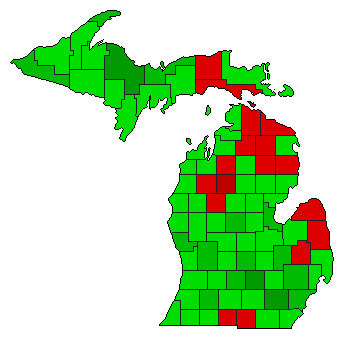 |  | Initiative |
4,099,087 |
2 |
0 |
1 |
924,209 |
22.55% |
38.73% |
0.00% |
61.27% |
0.00% |
1,587,439 |
0 |
2,511,648 |
0 |
 |  | Initiative |
4,134,521 |
2 |
0 |
1 |
1,398,457 |
33.82% |
33.09% |
0.00% |
66.91% |
0.00% |
1,368,032 |
0 |
2,766,489 |
0 |
|
