| Map | Pie | Office | Total | D | R | I | Margin | %Margin | Dem | Rep | Ind | Oth. | Dem | Rep | Ind | Other | | | | | | | | | | | | | | | | | | |
|---|
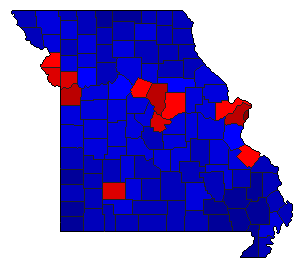
 |  | Senator |
2,442,289 |
2 |
1 |
3 |
141,992 |
5.81% |
45.57% |
51.38% |
1.41% |
1.64% |
1,112,935 |
1,254,927 |
34,398 |
40,029 |
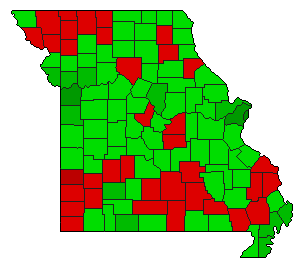
 |  | State Auditor |
2,383,021 |
1 |
2 |
3 |
135,571 |
5.69% |
50.33% |
44.64% |
2.17% |
2.86% |
1,199,346 |
1,063,775 |
51,652 |
68,248 |
| | | Map | Pie | Initiative | Total Vote | N | | Y | Margin | %Margin | No | | Yes | Oth. | No | | Yes | |
 |  | Initiative |
2,390,176 |
2 |
0 |
1 |
586,560 |
24.54% |
37.73% |
0.00% |
62.27% |
0.00% |
901,808 |
0 |
1,488,368 |
0 |
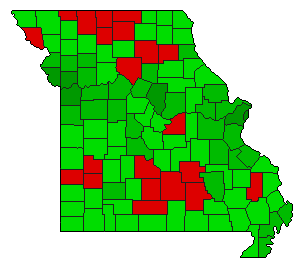 |  | Amendment |
2,399,369 |
2 |
0 |
1 |
745,815 |
31.08% |
34.46% |
0.00% |
65.54% |
0.00% |
826,777 |
0 |
1,572,592 |
0 |
|
