Note: The Google advertisement links below may advocate political positions that this site does not endorse.
| Map | Pie | Office | Total | D | R | I | Margin | %Margin | Dem | Rep | Ind | Oth. | Dem | Rep | Ind | Other | | | | | | | | | | | | | | | | | | |
|---|
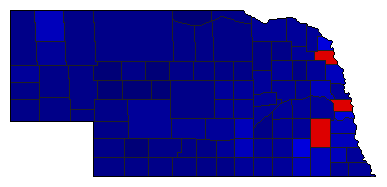
 |  | Senator |
698,883 |
2 |
1 |
0 |
133,234 |
19.06% |
38.62% |
57.69% |
0.00% |
3.69% |
269,917 |
403,151 |
0 |
25,815 |
 |  | Governor |
697,981 |
2 |
1 |
0 |
125,643 |
18.00% |
41.00% |
59.00% |
0.00% |
0.00% |
286,169 |
411,812 |
0 |
0 |
 |  | Secretary of State |
670,614 |
2 |
1 |
0 |
142,650 |
21.27% |
39.36% |
60.64% |
0.00% |
0.00% |
263,982 |
406,632 |
0 |
0 |
 |  | State Treasurer |
516,210 |
0 |
1 |
0 |
516,210 |
100.00% |
0.00% |
100.00% |
0.00% |
0.00% |
0 |
516,210 |
0 |
0 |
 |  | Attorney General |
516,777 |
0 |
1 |
0 |
516,777 |
100.00% |
0.00% |
100.00% |
0.00% |
0.00% |
0 |
516,777 |
0 |
0 |
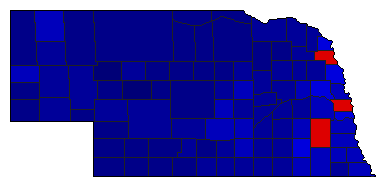
 |  | State Auditor |
661,335 |
2 |
1 |
0 |
99,997 |
15.12% |
42.44% |
57.56% |
0.00% |
0.00% |
280,669 |
380,666 |
0 |
0 |
|