| Map | Pie | Office | Total | D | R | I | Margin | %Margin | Dem | Rep | Ind | Oth. | Dem | Rep | Ind | Other | | | | | | | | | | | | | | | | | | |
|---|
 |  | Senator |
972,132 |
1 |
2 |
4 |
48,869 |
5.03% |
50.41% |
45.38% |
0.95% |
3.25% |
490,071 |
441,202 |
9,269 |
31,590 |
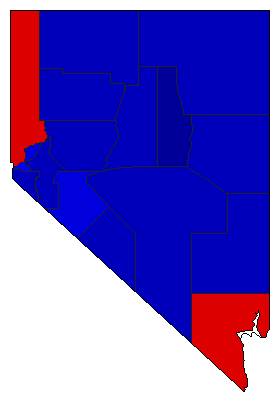
 |  | Governor |
971,799 |
1 |
2 |
4 |
39,687 |
4.08% |
49.39% |
45.31% |
1.43% |
3.87% |
480,007 |
440,320 |
13,891 |
37,581 |
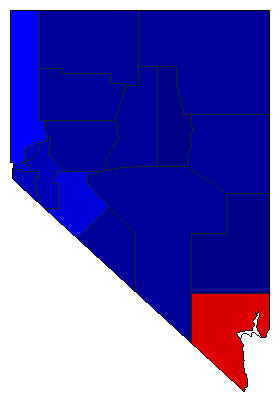
 |  | Lt. Governor |
965,943 |
1 |
2 |
5 |
64,684 |
6.70% |
50.35% |
43.66% |
1.08% |
4.91% |
486,381 |
421,697 |
10,435 |
47,430 |
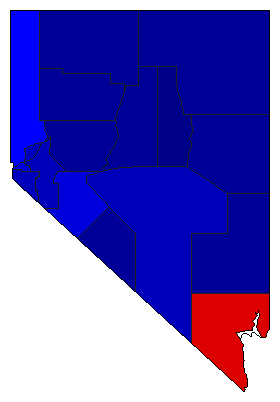
 |  | Secretary of State |
955,630 |
2 |
1 |
3 |
5,330 |
0.56% |
48.30% |
48.86% |
2.85% |
0.00% |
461,550 |
466,880 |
27,200 |
0 |
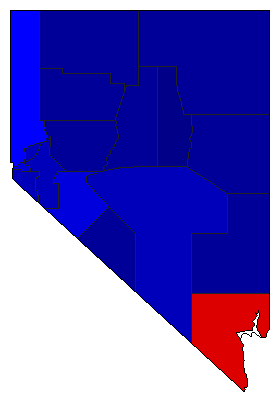
 |  | State Treasurer |
964,199 |
1 |
2 |
0 |
6,126 |
0.64% |
47.69% |
47.06% |
0.00% |
5.25% |
459,874 |
453,748 |
0 |
50,577 |
 |  | Attorney General |
965,753 |
1 |
2 |
0 |
4,533 |
0.47% |
47.24% |
46.77% |
0.00% |
5.99% |
456,225 |
451,692 |
0 |
57,836 |
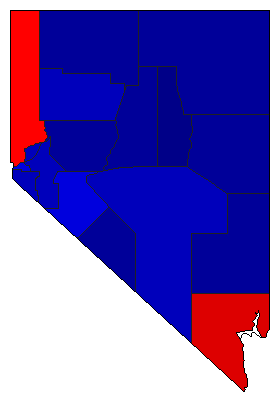 |  | Controller |
962,667 |
1 |
2 |
0 |
41,969 |
4.36% |
50.60% |
46.24% |
0.00% |
3.17% |
487,068 |
445,099 |
0 |
30,500 |
|