| Map | Pie | Office | Total | D | R | I | Margin | %Margin | Dem | Rep | Ind | Oth. | Dem | Rep | Ind | Other | | | | | | | | | | | | | | | | | | |
|---|
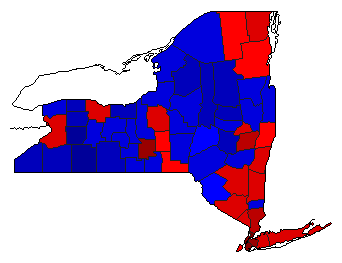
 |  | Senator |
6,059,023 |
1 |
2 |
0 |
2,058,711 |
33.98% |
66.96% |
32.98% |
0.00% |
0.06% |
4,056,931 |
1,998,220 |
0 |
3,872 |
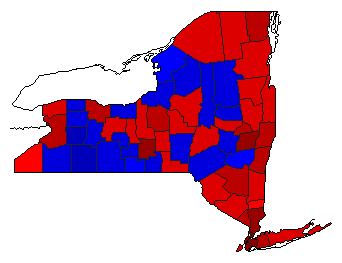
 |  | Governor |
6,104,477 |
1 |
2 |
0 |
1,427,738 |
23.39% |
59.55% |
36.16% |
0.00% |
4.28% |
3,635,340 |
2,207,602 |
0 |
261,535 |
 |  | Attorney General |
5,993,517 |
1 |
2 |
0 |
1,630,639 |
27.21% |
62.39% |
35.18% |
0.00% |
2.43% |
3,739,239 |
2,108,600 |
0 |
145,678 |
 |  | Comptroller General |
6,016,948 |
1 |
2 |
0 |
2,144,928 |
35.65% |
66.94% |
31.29% |
0.00% |
1.76% |
4,027,886 |
1,882,958 |
0 |
106,104 |
|
