| Map | Pie | Office | Total | D | R | I | Margin | %Margin | Dem | Rep | Ind | Oth. | Dem | Rep | Ind | Other | | | | | | | | | | | | | | | | | | |
|---|
 |  | Senator |
326,138 |
2 |
1 |
0 |
35,344 |
10.84% |
44.27% |
55.11% |
0.00% |
0.63% |
144,376 |
179,720 |
0 |
2,042 |
 |  | US Representative |
321,532 |
2 |
1 |
3 |
79,191 |
24.63% |
35.57% |
60.20% |
4.06% |
0.16% |
114,377 |
193,568 |
13,066 |
521 |
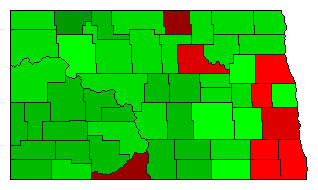 |  | Secretary of State |
307,277 |
2 |
0 |
1 |
24,800 |
8.07% |
39.21% |
0.00% |
47.28% |
13.51% |
120,475 |
0 |
145,275 |
41,527 |
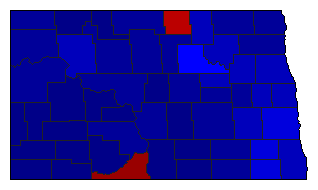 |  | Attorney General |
319,217 |
2 |
1 |
0 |
112,764 |
35.33% |
32.23% |
67.55% |
0.00% |
0.22% |
102,869 |
215,633 |
0 |
715 |
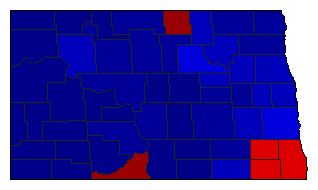 |  | Agriculture Commissioner |
315,259 |
2 |
1 |
0 |
112,775 |
35.77% |
32.01% |
67.78% |
0.00% |
0.21% |
100,914 |
213,689 |
0 |
656 |
| | | Map | Pie | Initiative | Total Vote | N | | Y | Margin | %Margin | No | | Yes | Oth. | No | | Yes | |
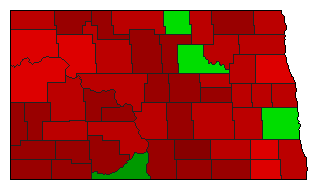 |  | Referendum |
326,036 |
1 |
0 |
2 |
61,638 |
18.91% |
59.45% |
0.00% |
40.55% |
0.00% |
193,837 |
0 |
132,199 |
0 |
|
