| Map | Pie | Office | Total | D | R | I | Margin | %Margin | Dem | Rep | Ind | Oth. | Dem | Rep | Ind | Other | | | | | | | | | | | | | | | | | | |
|---|
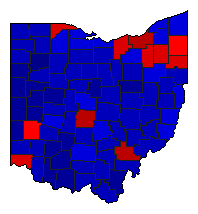
 |  | Senator |
4,417,084 |
1 |
2 |
0 |
300,949 |
6.81% |
53.40% |
46.58% |
0.00% |
0.02% |
2,358,508 |
2,057,559 |
0 |
1,017 |
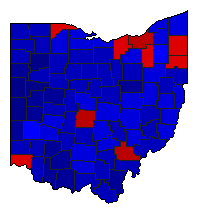
 |  | Governor |
4,435,820 |
2 |
1 |
0 |
165,779 |
3.74% |
46.67% |
50.40% |
0.00% |
2.93% |
2,070,046 |
2,235,825 |
0 |
129,949 |
 |  | Secretary of State |
4,363,771 |
2 |
1 |
0 |
160,412 |
3.68% |
46.98% |
50.65% |
0.00% |
2.37% |
2,049,944 |
2,210,356 |
0 |
103,471 |
 |  | State Treasurer |
4,326,460 |
2 |
1 |
0 |
282,428 |
6.53% |
46.74% |
53.26% |
0.00% |
0.00% |
2,022,016 |
2,304,444 |
0 |
0 |
 |  | Attorney General |
4,357,033 |
2 |
1 |
0 |
187,847 |
4.31% |
47.84% |
52.16% |
0.00% |
0.00% |
2,084,593 |
2,272,440 |
0 |
0 |
 |  | State Auditor |
4,334,763 |
2 |
1 |
0 |
146,565 |
3.38% |
46.28% |
49.66% |
0.00% |
4.06% |
2,006,204 |
2,152,769 |
0 |
175,790 |
|
