| Map | Pie | Office | Total | D | R | I | Margin | %Margin | Dem | Rep | Ind | Oth. | Dem | Rep | Ind | Other | | | | | | | | | | | | | | | | | | |
|---|
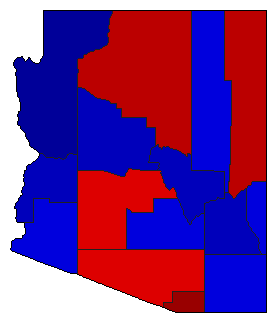
 |  | Senator |
2,384,308 |
1 |
2 |
0 |
55,900 |
2.34% |
49.96% |
47.61% |
0.00% |
2.43% |
1,191,100 |
1,135,200 |
0 |
58,008 |
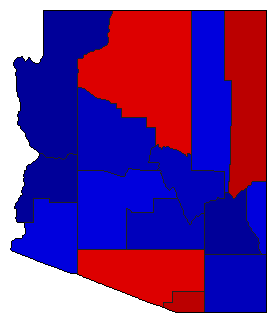
 |  | Governor |
2,376,441 |
2 |
1 |
0 |
336,522 |
14.16% |
41.84% |
56.00% |
0.00% |
2.16% |
994,341 |
1,330,863 |
0 |
51,237 |
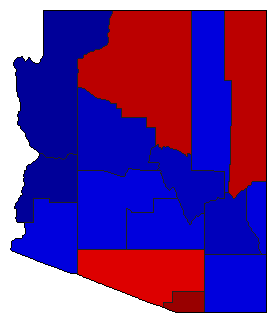
 |  | Secretary of State |
2,332,685 |
1 |
2 |
0 |
20,252 |
0.87% |
50.43% |
49.56% |
0.00% |
0.01% |
1,176,384 |
1,156,132 |
0 |
169 |
 |  | State Treasurer |
2,301,317 |
2 |
1 |
0 |
196,923 |
8.56% |
45.72% |
54.28% |
0.00% |
0.00% |
1,052,197 |
1,249,120 |
0 |
0 |
 |  | Attorney General |
2,322,124 |
2 |
1 |
0 |
80,672 |
3.47% |
48.26% |
51.74% |
0.00% |
0.00% |
1,120,726 |
1,201,398 |
0 |
0 |
|
