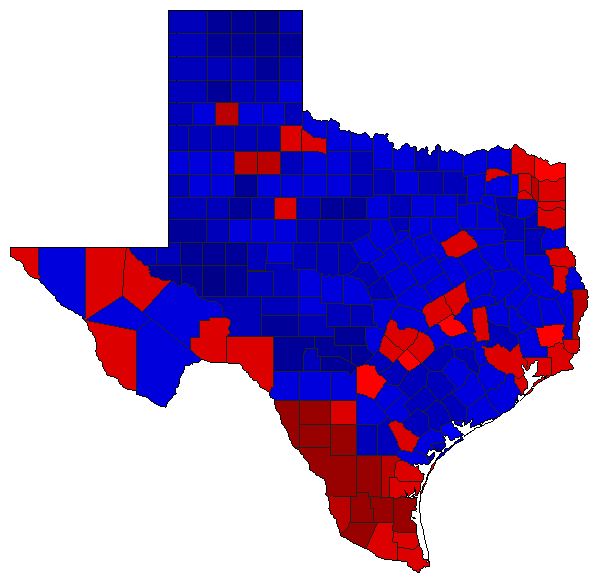
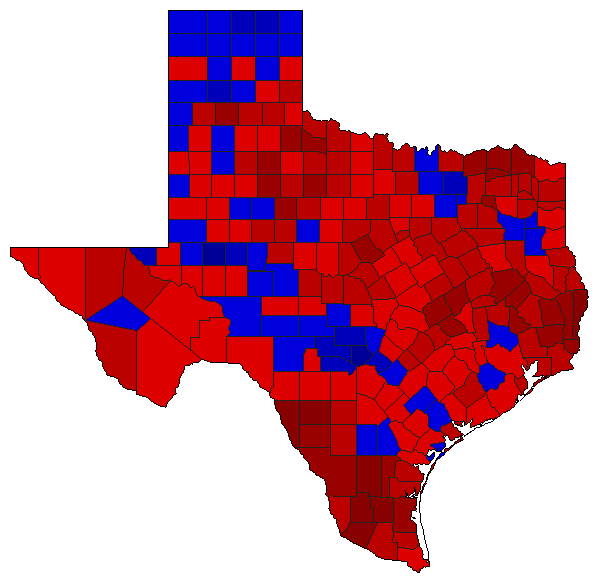
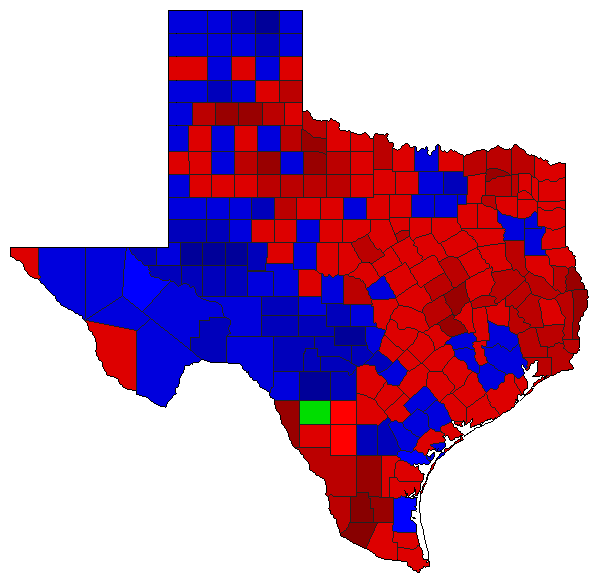
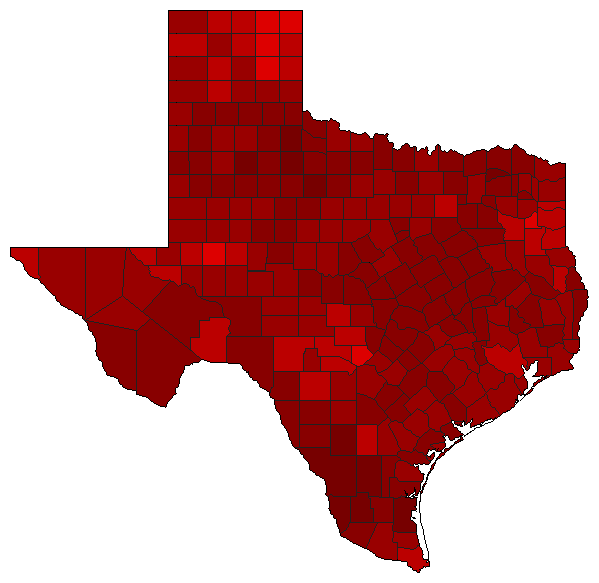
| Map | Pie | Year | Total | D | R | I | Margin | %Margin | Dem | Rep | Ind | Oth. | Dem | Rep | Ind | Other | | | | | | | | | | | | | | | | | | |
|---|
 |  | 2022 |
8,102,908 |
2 |
1 |
0 |
883,443 |
10.90% |
43.86% |
54.76% |
0.00% |
1.38% |
3,553,656 |
4,437,099 |
0 |
112,153 |
 |  | 2018 |
8,343,443 |
2 |
1 |
0 |
1,109,581 |
13.30% |
42.51% |
55.81% |
0.00% |
1.69% |
3,546,615 |
4,656,196 |
0 |
140,632 |
 |  | 2014 |
4,718,268 |
2 |
1 |
0 |
960,951 |
20.37% |
38.90% |
59.27% |
0.00% |
1.83% |
1,835,596 |
2,796,547 |
0 |
86,125 |
 |  | 2010 |
4,979,870 |
2 |
1 |
0 |
631,086 |
12.67% |
42.30% |
54.97% |
0.00% |
2.73% |
2,106,395 |
2,737,481 |
0 |
135,994 |
 |  | 2006 |
4,399,068 |
2 |
1 |
3 |
406,450 |
9.24% |
29.79% |
39.03% |
18.13% |
13.06% |
1,310,353 |
1,716,803 |
797,577 |
574,335 |
 |  | 2002 |
4,553,979 |
2 |
1 |
0 |
812,698 |
17.85% |
39.96% |
57.81% |
0.00% |
2.23% |
1,819,843 |
2,632,541 |
0 |
101,595 |
 |  | 1998 |
3,738,078 |
2 |
1 |
0 |
1,385,229 |
37.06% |
31.18% |
68.24% |
0.00% |
0.58% |
1,165,592 |
2,550,821 |
0 |
21,665 |
 |  | 1994 |
4,396,242 |
2 |
1 |
0 |
334,066 |
7.60% |
45.88% |
53.48% |
0.00% |
0.64% |
2,016,928 |
2,350,994 |
0 |
28,320 |
 |  | 1990 |
3,892,746 |
1 |
2 |
0 |
99,239 |
2.55% |
49.47% |
46.92% |
0.00% |
3.61% |
1,925,670 |
1,826,431 |
0 |
140,645 |
 |  | 1986 |
3,441,460 |
2 |
1 |
0 |
229,264 |
6.66% |
46.04% |
52.70% |
0.00% |
1.25% |
1,584,515 |
1,813,779 |
0 |
43,166 |
 |  | 1982 |
3,191,091 |
1 |
2 |
6 |
231,933 |
7.27% |
53.21% |
45.94% |
0.00% |
0.85% |
1,697,870 |
1,465,937 |
15 |
27,269 |
 |  | 1978 |
2,370,030 |
2 |
1 |
3 |
17,355 |
0.73% |
49.24% |
49.97% |
0.60% |
0.20% |
1,166,919 |
1,184,274 |
14,213 |
4,624 |
 | | 1964 |
2,544,725 |
1 |
2 |
0 |
1,216,118 |
47.79% |
73.79% |
26.00% |
0.00% |
0.21% |
1,877,793 |
661,675 |
0 |
5,257 |
|