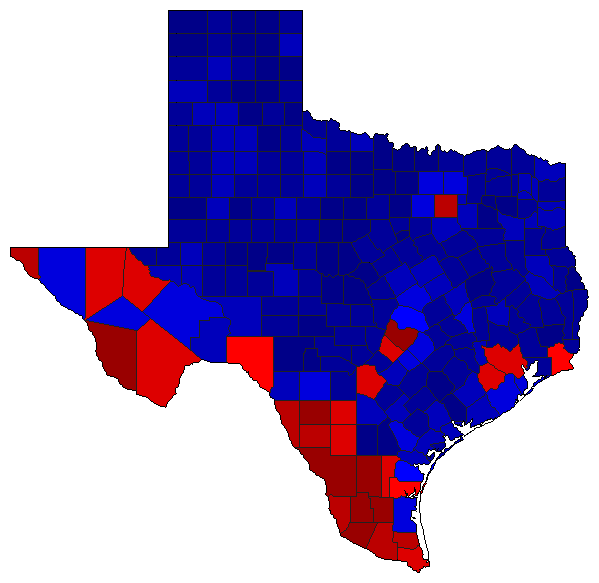
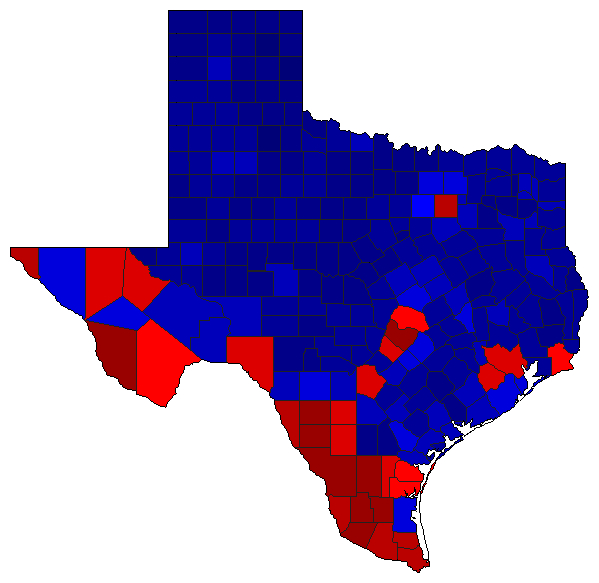
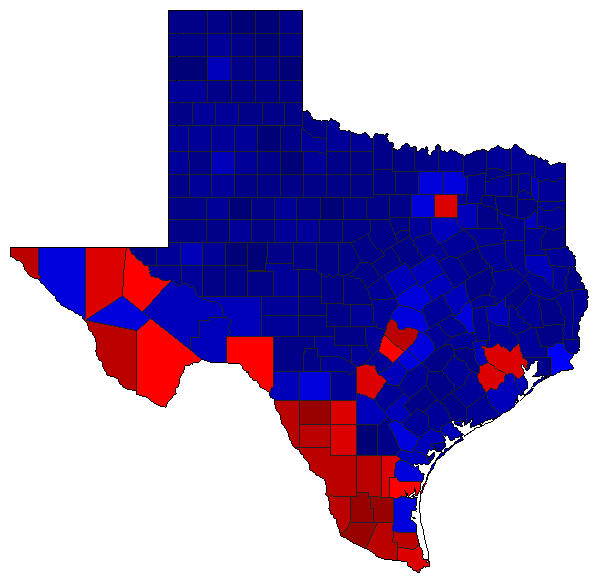
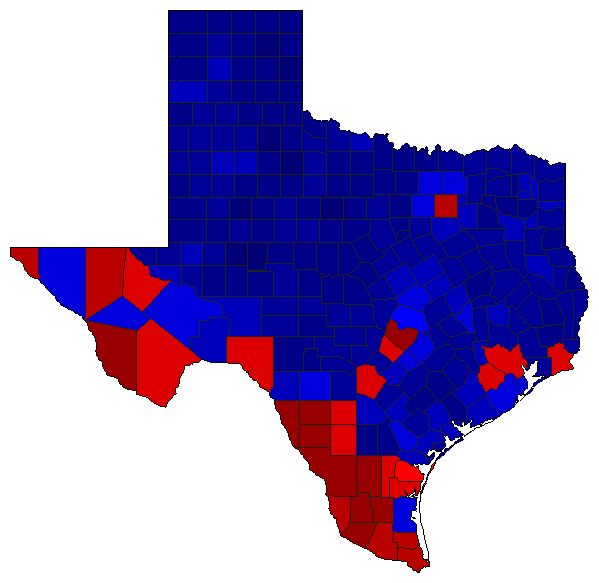
| Map | Pie | Office | Total | D | R | I | Margin | %Margin | Dem | Rep | Ind | Oth. | Dem | Rep | Ind | Other | | | | | | | | | | | | | | | | | | |
|---|
 |  | Senator |
8,371,655 |
2 |
1 |
0 |
214,921 |
2.57% |
48.33% |
50.89% |
0.00% |
0.78% |
4,045,632 |
4,260,553 |
0 |
65,470 |
 |  | Governor |
8,343,443 |
2 |
1 |
0 |
1,109,581 |
13.30% |
42.51% |
55.81% |
0.00% |
1.69% |
3,546,615 |
4,656,196 |
0 |
140,632 |
 |  | Lt. Governor |
8,305,371 |
2 |
1 |
0 |
400,125 |
4.82% |
46.49% |
51.30% |
0.00% |
2.21% |
3,860,865 |
4,260,990 |
0 |
183,516 |
 |  | Attorney General |
8,292,615 |
2 |
1 |
0 |
295,109 |
3.56% |
47.01% |
50.57% |
0.00% |
2.43% |
3,898,098 |
4,193,207 |
0 |
201,310 |
 |  | Comptroller General |
8,228,602 |
2 |
1 |
0 |
806,135 |
9.80% |
43.39% |
53.19% |
0.00% |
3.42% |
3,570,693 |
4,376,828 |
0 |
281,081 |
 |  | Agriculture Commissioner |
8,235,303 |
2 |
1 |
0 |
399,390 |
4.85% |
46.41% |
51.26% |
0.00% |
2.33% |
3,822,137 |
4,221,527 |
0 |
191,639 |
|