2018 General Election Results Comparison - Arkansas
| Map | Pie | Office | Total | D | R | I | Margin | %Margin | Dem | Rep | Ind | Oth. | Dem | Rep | Ind | Other |
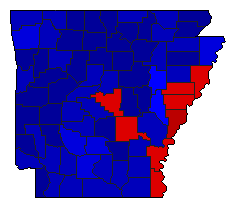
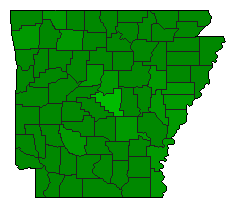
 |  | Governor | 891,509 | 2 | 1 | 0 | 299,188 | 33.56% | 31.77% | 65.33% | 0.00% | 2.90% | 283,218 | 582,406 | 0 | 25,885 |
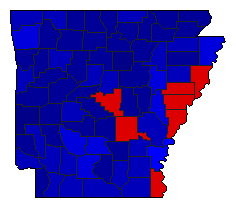
 |  | Lt. Governor | 888,735 | 2 | 1 | 0 | 276,898 | 31.16% | 33.03% | 64.18% | 0.00% | 2.79% | 293,535 | 570,433 | 0 | 24,767 |
 |  | Secretary of State | 886,545 | 2 | 1 | 0 | 213,937 | 24.13% | 36.51% | 60.64% | 0.00% | 2.86% | 323,644 | 537,581 | 0 | 25,320 |
 |  | State Treasurer | 862,132 | 0 | 1 | 0 | 360,246 | 41.79% | 0.00% | 70.89% | 0.00% | 29.11% | 0 | 611,189 | 0 | 250,943 |
 |  | Attorney General | 889,419 | 2 | 1 | 0 | 234,569 | 26.37% | 35.43% | 61.80% | 0.00% | 2.77% | 315,099 | 549,668 | 0 | 24,652 |
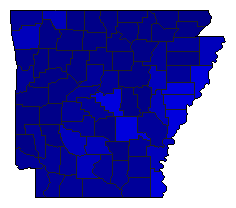 |  | State Auditor | 859,374 | 0 | 1 | 0 | 389,676 | 45.34% | 0.00% | 72.67% | 0.00% | 27.33% | 0 | 624,525 | 0 | 234,849 |
| Map | Pie | Initiative | Total Vote | N | Y | Margin | %Margin | No | Yes | Oth. | No | Yes | ||||
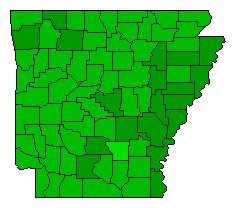 |  | Initiative | 880,544 | 2 | 0 | 1 | 324,738 | 36.88% | 31.56% | 0.00% | 68.44% | 0.00% | 277,903 | 0 | 602,641 | 0 |
 |  | Amendment | 867,269 | 2 | 0 | 1 | 511,639 | 58.99% | 20.50% | 0.00% | 79.50% | 0.00% | 177,815 | 0 | 689,454 | 0 |
Arkansas Results for 2018
Login
© Dave Leip's Atlas of U.S. Elections, LLC 2019 All Rights Reserved
Note: The advertisement links below may advocate political positions that this site does not endorse.
Login
© Dave Leip's Atlas of U.S. Elections, LLC 2019 All Rights Reserved
Note: The advertisement links below may advocate political positions that this site does not endorse.