2018 General Election Results Comparison - West Virginia
| Map | Pie | Office | Total | D | R | I | Margin | %Margin | Dem | Rep | Ind | Oth. | Dem | Rep | Ind | Other |
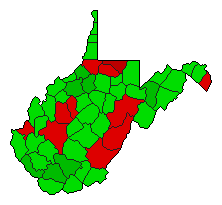
 |  | Senator | 586,034 | 1 | 2 | 0 | 19,397 | 3.31% | 49.57% | 46.26% | 0.00% | 4.17% | 290,510 | 271,113 | 0 | 24,411 |
| Map | Pie | Initiative | Total Vote | N | Y | Margin | %Margin | No | Yes | Oth. | No | Yes | ||||
 |  | Amendment | 574,372 | 2 | 0 | 1 | 19,712 | 3.43% | 48.28% | 0.00% | 51.72% | 0.00% | 277,330 | 0 | 297,042 | 0 |
West Virginia Results for 2018
Login
© Dave Leip's Atlas of U.S. Elections, LLC 2019 All Rights Reserved
Note: The advertisement links below may advocate political positions that this site does not endorse.
Login
© Dave Leip's Atlas of U.S. Elections, LLC 2019 All Rights Reserved
Note: The advertisement links below may advocate political positions that this site does not endorse.