| Map | Pie | Office | Total | D | R | I | Margin | %Margin | Dem | Rep | Ind | Oth. | Dem | Rep | Ind | Other | | | | | | | | | | | | | | | | | | |
|---|
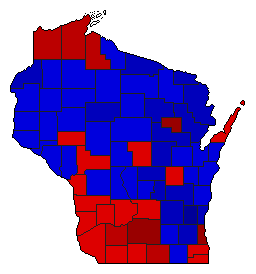
 |  | Senator |
2,660,763 |
1 |
2 |
0 |
288,029 |
10.83% |
55.36% |
44.53% |
0.00% |
0.11% |
1,472,914 |
1,184,885 |
0 |
2,964 |
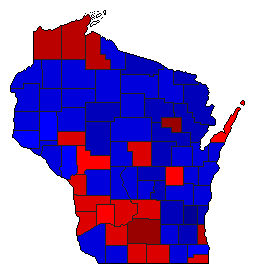
 |  | Governor |
2,673,308 |
1 |
2 |
4 |
29,227 |
1.09% |
49.54% |
48.44% |
0.71% |
1.31% |
1,324,307 |
1,295,080 |
18,884 |
35,037 |
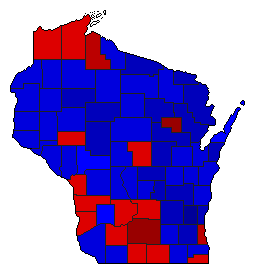
 |  | Secretary of State |
2,617,948 |
1 |
2 |
0 |
145,718 |
5.57% |
52.74% |
47.18% |
0.00% |
0.08% |
1,380,752 |
1,235,034 |
0 |
2,162 |
 |  | State Treasurer |
2,601,962 |
1 |
2 |
0 |
107,299 |
4.12% |
50.89% |
46.77% |
0.00% |
2.35% |
1,324,110 |
1,216,811 |
0 |
61,041 |
 |  | Attorney General |
2,642,851 |
1 |
2 |
0 |
17,190 |
0.65% |
49.41% |
48.76% |
0.00% |
1.83% |
1,305,902 |
1,288,712 |
0 |
48,237 |
|
