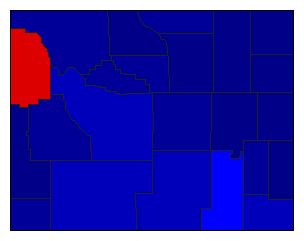
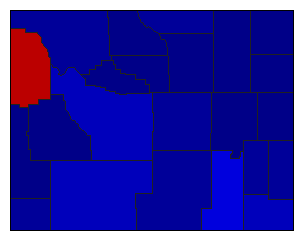
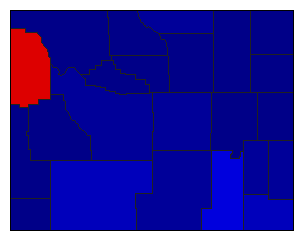
| Map | Pie | Office | Total | D | R | I | Margin | %Margin | Dem | Rep | Ind | Oth. | Dem | Rep | Ind | Other | | | | | | | | | | | | | | | | | | |
|---|
 |  | Senator |
203,420 |
2 |
1 |
0 |
74,983 |
36.86% |
30.10% |
66.96% |
0.00% |
2.94% |
61,227 |
136,210 |
0 |
5,983 |
 |  | US Representative |
201,245 |
2 |
1 |
0 |
68,060 |
33.82% |
29.77% |
63.59% |
0.00% |
6.65% |
59,903 |
127,963 |
0 |
13,379 |
 |  | Governor |
203,238 |
2 |
1 |
0 |
80,447 |
39.58% |
27.54% |
67.12% |
0.00% |
5.34% |
55,965 |
136,412 |
0 |
10,861 |
 |  | Secretary of State |
199,098 |
2 |
1 |
0 |
83,671 |
42.03% |
26.80% |
68.82% |
0.00% |
4.38% |
53,355 |
137,026 |
0 |
8,717 |
 |  | State Treasurer |
196,937 |
2 |
1 |
0 |
86,961 |
44.16% |
27.86% |
72.02% |
0.00% |
0.12% |
54,865 |
141,826 |
0 |
246 |
 |  | State Auditor |
196,663 |
2 |
1 |
0 |
91,519 |
46.54% |
26.68% |
73.21% |
0.00% |
0.11% |
52,461 |
143,980 |
0 |
222 |
|