2018 General Election Results Comparison - California
| Map | Pie | Office | Total | D | R | I | Margin | %Margin | Dem | Rep | Ind | Oth. | Dem | Rep | Ind | Other |
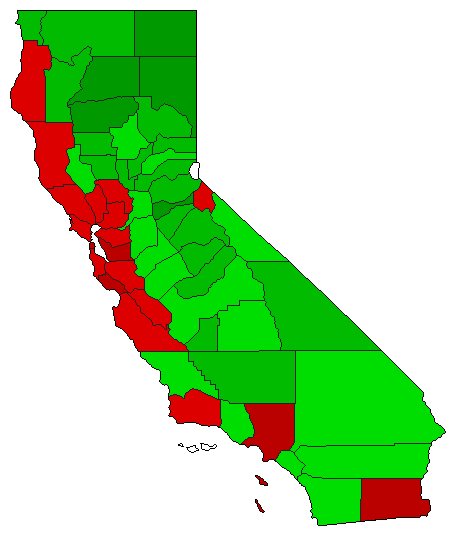
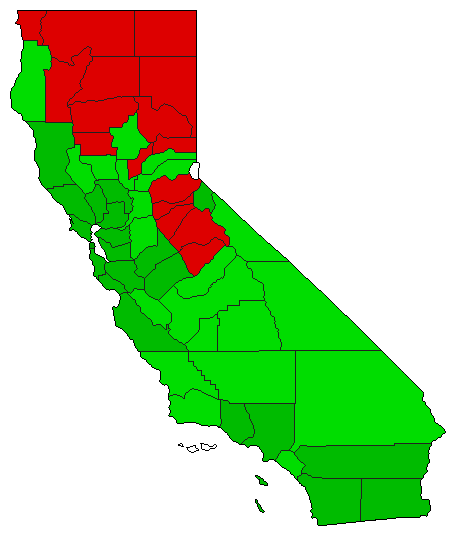
 |  | Senator | 11,113,364 | 1 | 0 | 0 | 6,019,422 | 54.16% | 54.16% | 0.00% | 0.00% | 45.84% | 6,019,422 | 0 | 0 | 5,093,942 |
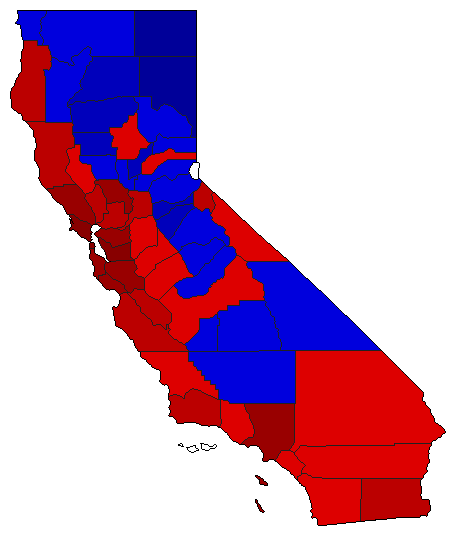
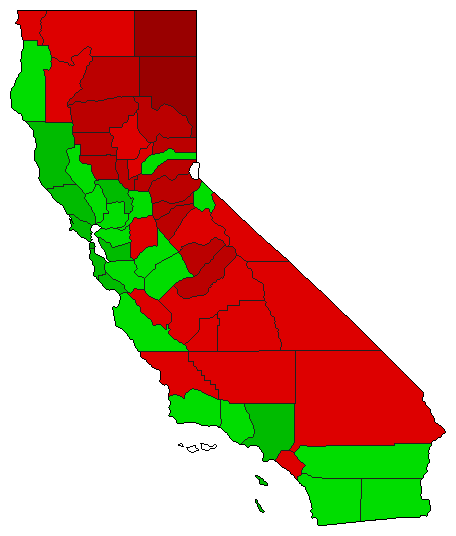
 |  | Governor | 12,464,235 | 1 | 2 | 0 | 2,978,585 | 23.90% | 61.95% | 38.05% | 0.00% | 0.00% | 7,721,410 | 4,742,825 | 0 | 0 |
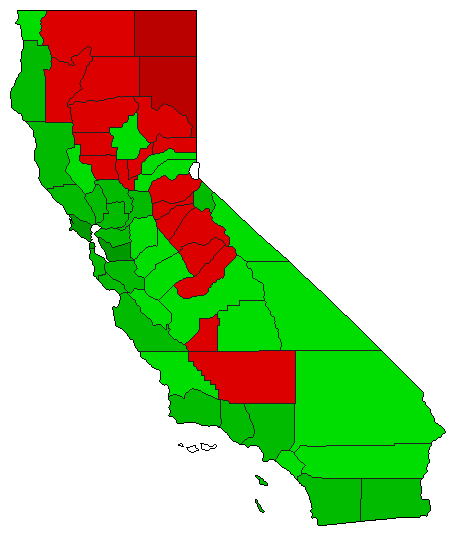
 |  | Lt. Governor | 10,457,931 | 1 | 0 | 0 | 1,370,205 | 13.10% | 56.55% | 0.00% | 0.00% | 43.45% | 5,914,068 | 0 | 0 | 4,543,863 |
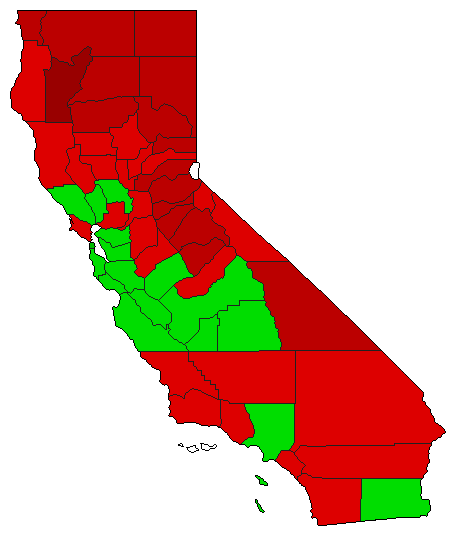
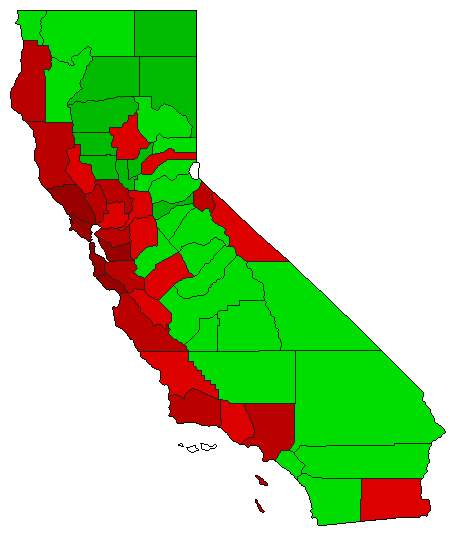
 |  | Secretary of State | 12,272,066 | 1 | 2 | 0 | 3,546,976 | 28.90% | 64.45% | 35.55% | 0.00% | 0.00% | 7,909,521 | 4,362,545 | 0 | 0 |
 |  | State Treasurer | 12,202,403 | 1 | 2 | 0 | 3,448,771 | 28.26% | 64.13% | 35.87% | 0.00% | 0.00% | 7,825,587 | 4,376,816 | 0 | 0 |
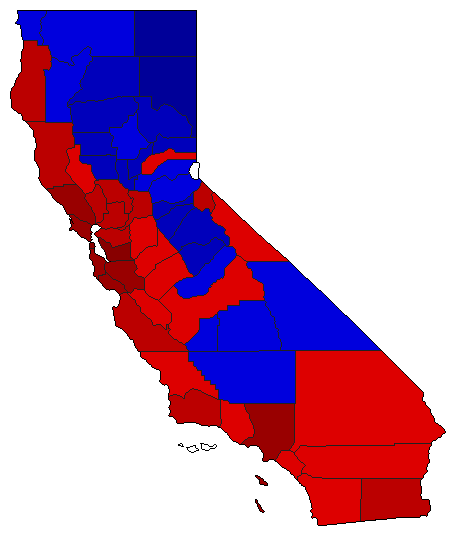 |  | Attorney General | 12,256,330 | 1 | 2 | 0 | 3,325,156 | 27.13% | 63.57% | 36.43% | 0.00% | 0.00% | 7,790,743 | 4,465,587 | 0 | 0 |
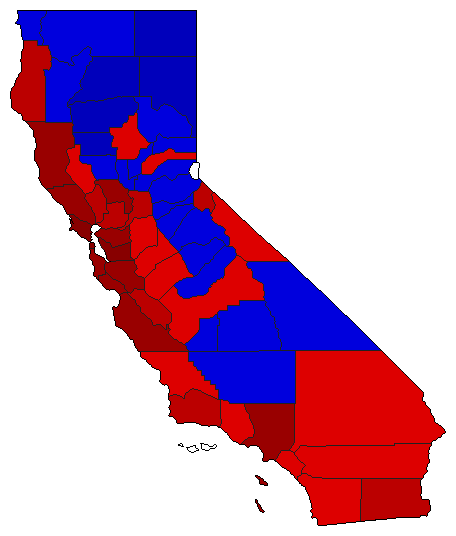 |  | Controller | 12,242,547 | 1 | 2 | 0 | 3,783,587 | 30.91% | 65.45% | 34.55% | 0.00% | 0.00% | 8,013,067 | 4,229,480 | 0 | 0 |
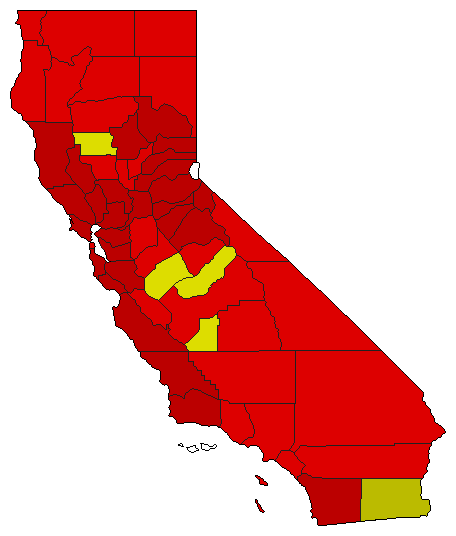
 |  | Insurance Commissioner | 10,309,558 | 1 | 0 | 2 | 415,712 | 4.03% | 52.02% | 0.00% | 47.98% | 0.00% | 5,362,635 | 0 | 4,946,923 | 0 |
| Map | Pie | Initiative | Total Vote | N | Y | Margin | %Margin | No | Yes | Oth. | No | Yes | ||||
 |  | Referendum | 12,009,175 | 2 | 0 | 1 | 1,492,861 | 12.43% | 43.78% | 0.00% | 56.22% | 0.00% | 5,258,157 | 0 | 6,751,018 | 0 |
 |  | Referendum | 12,079,855 | 2 | 0 | 1 | 3,245,201 | 26.86% | 36.57% | 0.00% | 63.43% | 0.00% | 4,417,327 | 0 | 7,662,528 | 0 |
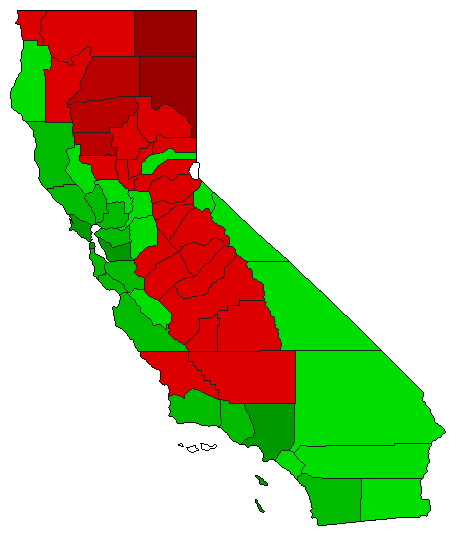
 |  | Referendum | 11,914,827 | 1 | 0 | 2 | 155,155 | 1.30% | 50.65% | 0.00% | 49.35% | 0.00% | 6,034,991 | 0 | 5,879,836 | 0 |
 |  | Referendum | 12,045,441 | 2 | 0 | 1 | 3,057,155 | 25.38% | 37.31% | 0.00% | 62.69% | 0.00% | 4,494,143 | 0 | 7,551,298 | 0 |
 |  | Referendum | 11,966,244 | 1 | 0 | 2 | 2,339,742 | 19.55% | 59.78% | 0.00% | 40.22% | 0.00% | 7,152,993 | 0 | 4,813,251 | 0 |
 |  | Referendum | 12,235,303 | 1 | 0 | 2 | 1,668,859 | 13.64% | 56.82% | 0.00% | 43.18% | 0.00% | 6,952,081 | 0 | 5,283,222 | 0 |
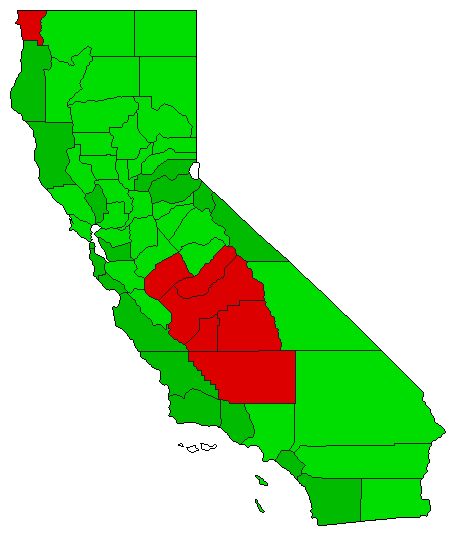 |  | Initiative | 11,995,879 | 2 | 0 | 1 | 2,338,751 | 19.50% | 40.25% | 0.00% | 59.75% | 0.00% | 4,828,564 | 0 | 7,167,315 | 0 |
 |  | Initiative | 12,051,136 | 2 | 0 | 1 | 3,051,732 | 25.32% | 37.34% | 0.00% | 62.66% | 0.00% | 4,499,702 | 0 | 7,551,434 | 0 |
California Results for 2018
Login
© Dave Leip's Atlas of U.S. Elections, LLC 2019 All Rights Reserved
Note: The advertisement links below may advocate political positions that this site does not endorse.
Login
© Dave Leip's Atlas of U.S. Elections, LLC 2019 All Rights Reserved
Note: The advertisement links below may advocate political positions that this site does not endorse.