| Map | Pie | Office | Total | D | R | I | Margin | %Margin | Dem | Rep | Ind | Oth. | Dem | Rep | Ind | Other | | | | | | | | | | | | | | | | | | |
|---|
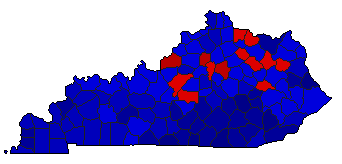
 |  | Governor |
1,443,123 |
1 |
2 |
0 |
5,136 |
0.36% |
49.19% |
48.84% |
0.00% |
1.97% |
709,890 |
704,754 |
0 |
28,479 |
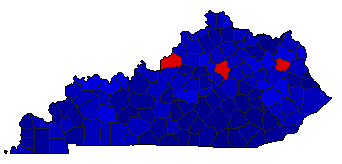
 |  | Secretary of State |
1,428,725 |
2 |
1 |
0 |
64,533 |
4.52% |
47.74% |
52.26% |
0.00% |
0.00% |
682,096 |
746,629 |
0 |
0 |
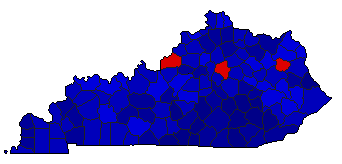
 |  | State Treasurer |
1,411,409 |
2 |
1 |
0 |
300,891 |
21.32% |
39.34% |
60.66% |
0.00% |
0.00% |
555,259 |
856,150 |
0 |
0 |
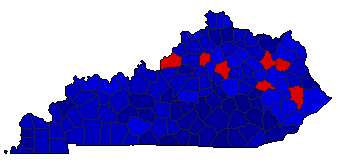 |  | Attorney General |
1,425,618 |
2 |
1 |
0 |
221,074 |
15.51% |
42.25% |
57.75% |
0.00% |
0.00% |
602,272 |
823,346 |
0 |
0 |
 |  | State Auditor |
1,401,113 |
2 |
1 |
0 |
204,910 |
14.62% |
41.03% |
55.65% |
0.00% |
3.32% |
574,820 |
779,730 |
0 |
46,563 |
 |  | Agriculture Commissioner |
1,411,109 |
2 |
1 |
0 |
276,315 |
19.58% |
38.63% |
58.21% |
0.00% |
3.16% |
545,099 |
821,414 |
0 |
44,596 |
|
