2020 General Election Results Comparison - Illinois
| Map | Pie | Office | Total | D | R | I | Margin | %Margin | Dem | Rep | Ind | Oth. | Dem | Rep | Ind | Other |
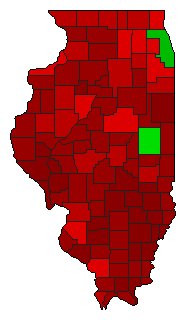
 |  | President | 6,049,516 | 1 | 2 | 0 | 1,025,024 | 16.94% | 57.39% | 40.45% | 0.00% | 2.16% | 3,471,915 | 2,446,891 | 0 | 130,710 |
 |  | Senator | 5,968,901 | 1 | 2 | 0 | 959,060 | 16.07% | 54.93% | 38.87% | 0.00% | 6.20% | 3,278,930 | 2,319,870 | 0 | 370,101 |
| Map | Pie | Initiative | Total Vote | N | Y | Margin | %Margin | No | Yes | Oth. | No | Yes | ||||
 |  | Referendum | 5,742,901 | 1 | 0 | 2 | 375,921 | 6.55% | 53.27% | 0.00% | 46.73% | 0.00% | 3,059,411 | 0 | 2,683,490 | 0 |
Illinois Results for 2020
Login
© Dave Leip's Atlas of U.S. Elections, LLC 2019 All Rights Reserved
Note: The advertisement links below may advocate political positions that this site does not endorse.
Login
© Dave Leip's Atlas of U.S. Elections, LLC 2019 All Rights Reserved
Note: The advertisement links below may advocate political positions that this site does not endorse.