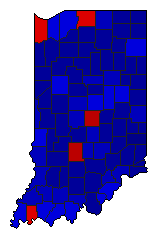
2020 General Election Results Comparison - Indiana
| Map | Pie | Office | Total | D | R | I | Margin | %Margin | Dem | Rep | Ind | Oth. | Dem | Rep | Ind | Other |
 |  | President | 3,039,801 | 2 | 1 | 0 | 487,358 | 16.03% | 40.87% | 56.91% | 0.00% | 2.22% | 1,242,505 | 1,729,863 | 0 | 67,433 |
 |  | Governor | 3,020,388 | 2 | 1 | 0 | 738,633 | 24.45% | 32.05% | 56.51% | 0.00% | 11.44% | 968,094 | 1,706,727 | 0 | 345,567 |
 |  | Attorney General | 2,951,619 | 2 | 1 | 0 | 492,371 | 16.68% | 41.66% | 58.34% | 0.00% | 0.00% | 1,229,624 | 1,721,995 | 0 | 0 |
Indiana Results for 2020
Login
© Dave Leip's Atlas of U.S. Elections, LLC 2019 All Rights Reserved
Note: The advertisement links below may advocate political positions that this site does not endorse.
Login
© Dave Leip's Atlas of U.S. Elections, LLC 2019 All Rights Reserved
Note: The advertisement links below may advocate political positions that this site does not endorse.