| Map | Pie | Office | Total | D | R | I | Margin | %Margin | Dem | Rep | Ind | Oth. | Dem | Rep | Ind | Other | | | | | | | | | | | | | | | | | | |
|---|
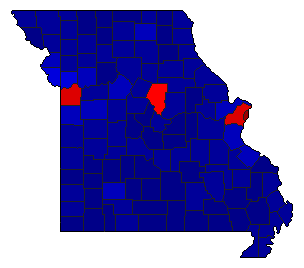
 |  | President |
3,030,748 |
2 |
1 |
0 |
465,722 |
15.37% |
41.34% |
56.71% |
0.00% |
1.95% |
1,253,014 |
1,718,736 |
0 |
58,998 |
 |  | Governor |
3,012,287 |
2 |
1 |
0 |
494,431 |
16.41% |
40.69% |
57.11% |
0.00% |
2.20% |
1,225,771 |
1,720,202 |
0 |
66,314 |
 |  | Lt. Governor |
2,963,492 |
2 |
1 |
0 |
581,032 |
19.61% |
38.81% |
58.42% |
0.00% |
2.77% |
1,150,231 |
1,731,263 |
0 |
81,998 |
 |  | Secretary of State |
2,972,483 |
2 |
1 |
0 |
717,392 |
24.13% |
36.37% |
60.51% |
0.00% |
3.12% |
1,081,113 |
1,798,505 |
0 |
92,865 |
 |  | State Treasurer |
2,949,212 |
2 |
1 |
0 |
620,396 |
21.04% |
38.06% |
59.10% |
0.00% |
2.84% |
1,122,547 |
1,742,943 |
0 |
83,722 |
 |  | Attorney General |
2,951,605 |
2 |
1 |
0 |
635,079 |
21.52% |
37.87% |
59.38% |
0.00% |
2.75% |
1,117,713 |
1,752,792 |
0 |
81,100 |
|
