2020 General Election Results Comparison - Nevada
| Map | Pie | Office | Total | D | R | I | Margin | %Margin | Dem | Rep | Ind | Oth. | Dem | Rep | Ind | Other |
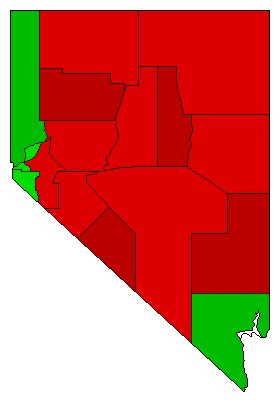
 |  | President | 1,405,376 | 1 | 2 | 0 | 33,596 | 2.39% | 50.06% | 47.67% | 0.00% | 2.28% | 703,486 | 669,890 | 0 | 32,000 |
| Map | Pie | Initiative | Total Vote | N | Y | Margin | %Margin | No | Yes | Oth. | No | Yes | ||||
 |  | Initiative | 1,315,236 | 2 | 0 | 1 | 326,864 | 24.85% | 37.57% | 0.00% | 62.43% | 0.00% | 494,186 | 0 | 821,050 | 0 |
Nevada Results for 2020
Login
© Dave Leip's Atlas of U.S. Elections, LLC 2019 All Rights Reserved
Note: The advertisement links below may advocate political positions that this site does not endorse.
Login
© Dave Leip's Atlas of U.S. Elections, LLC 2019 All Rights Reserved
Note: The advertisement links below may advocate political positions that this site does not endorse.