| Map | Pie | Office | Total | D | R | I | Margin | %Margin | Dem | Rep | Ind | Oth. | Dem | Rep | Ind | Other | | | | | | | | | | | | | | | | | | |
|---|
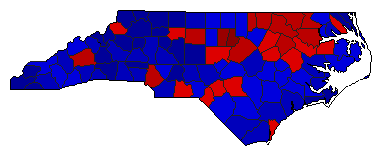
 |  | President |
5,524,804 |
2 |
1 |
0 |
74,483 |
1.35% |
48.59% |
49.93% |
0.00% |
1.48% |
2,684,292 |
2,758,775 |
0 |
81,737 |
 |  | Senator |
5,474,952 |
2 |
1 |
0 |
95,633 |
1.75% |
46.94% |
48.69% |
0.00% |
4.37% |
2,569,965 |
2,665,598 |
0 |
239,389 |
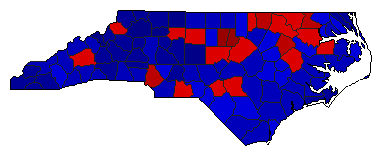
 |  | Governor |
5,502,778 |
1 |
2 |
0 |
248,185 |
4.51% |
51.52% |
47.01% |
0.00% |
1.48% |
2,834,790 |
2,586,605 |
0 |
81,383 |
 |  | Lt. Governor |
5,424,113 |
2 |
1 |
0 |
177,197 |
3.27% |
48.37% |
51.63% |
0.00% |
0.00% |
2,623,458 |
2,800,655 |
0 |
0 |
 |  | Secretary of State |
5,386,127 |
1 |
2 |
0 |
125,013 |
2.32% |
51.16% |
48.84% |
0.00% |
0.00% |
2,755,570 |
2,630,557 |
0 |
0 |
 |  | State Treasurer |
5,349,816 |
2 |
1 |
0 |
275,778 |
5.15% |
47.42% |
52.58% |
0.00% |
0.00% |
2,537,019 |
2,812,797 |
0 |
0 |
 |  | Attorney General |
5,413,177 |
1 |
2 |
0 |
13,623 |
0.25% |
50.13% |
49.87% |
0.00% |
0.00% |
2,713,400 |
2,699,777 |
0 |
0 |
 |  | State Auditor |
5,365,999 |
1 |
2 |
0 |
94,351 |
1.76% |
50.88% |
49.12% |
0.00% |
0.00% |
2,730,175 |
2,635,824 |
0 |
0 |
 |  | Insurance Commissioner |
5,361,951 |
2 |
1 |
0 |
189,023 |
3.53% |
48.24% |
51.76% |
0.00% |
0.00% |
2,586,464 |
2,775,487 |
0 |
0 |
 |  | Agriculture Commissioner |
5,387,570 |
2 |
1 |
0 |
416,126 |
7.72% |
46.14% |
53.86% |
0.00% |
0.00% |
2,485,722 |
2,901,848 |
0 |
0 |
|
