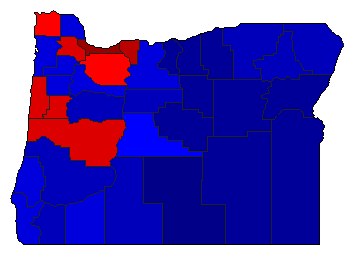
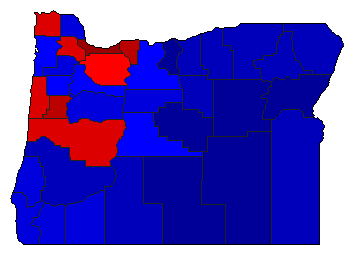
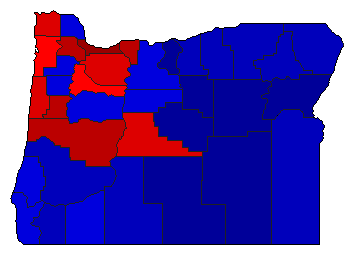
| Map | Pie | Office | Total | D | R | I | Margin | %Margin | Dem | Rep | Ind | Oth. | Dem | Rep | Ind | Other | | | | | | | | | | | | | | | | | | |
|---|
 |  | President |
2,374,321 |
1 |
2 |
0 |
381,935 |
16.09% |
56.45% |
40.37% |
0.00% |
3.18% |
1,340,383 |
958,448 |
0 |
75,490 |
 |  | Senator |
2,321,249 |
1 |
2 |
0 |
408,233 |
17.59% |
56.91% |
39.32% |
0.00% |
3.76% |
1,321,047 |
912,814 |
0 |
87,388 |
 |  | Secretary of State |
2,278,503 |
1 |
2 |
0 |
161,773 |
7.10% |
50.31% |
43.21% |
0.00% |
6.48% |
1,146,370 |
984,597 |
0 |
147,536 |
 |  | State Treasurer |
2,257,455 |
1 |
2 |
0 |
229,787 |
10.18% |
51.68% |
41.50% |
0.00% |
6.81% |
1,166,703 |
936,916 |
0 |
153,836 |
 |  | Attorney General |
2,259,650 |
1 |
2 |
0 |
330,359 |
14.62% |
55.97% |
41.35% |
0.00% |
2.68% |
1,264,716 |
934,357 |
0 |
60,577 |
|