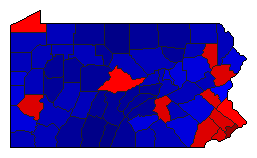
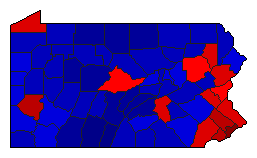
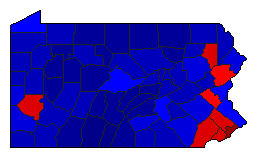
2020 General Election Results Comparison - Pennsylvania
Note: The Google advertisement links below may advocate political positions that this site does not endorse.
MapPieOfficeTotalDRIMargin%MarginDemRepIndOth.DemRepIndOther 
                 
MapMapPresident 6,940,449 1 2 11 82,166 1.18% 49.87% 48.69% 0.00% 1.44% 3,461,221 3,379,055 33 100,140
MapMapState Treasurer 6,621,781 2 1 3 78,485 1.19% 47.71% 48.90% 2.19% 1.20% 3,159,390 3,237,875 144,814 79,702
MapMapAttorney General 6,806,596 1 2 3 307,641 4.52% 50.85% 46.33% 1.77% 1.04% 3,461,472 3,153,831 120,489 70,804
MapMapState Auditor 6,600,602 2 1 3 232,965 3.53% 46.14% 49.67% 3.04% 1.15% 3,045,307 3,278,272 200,803 76,220

Pennsylvania Results for 2020

Login

Terms of Use - DCMA Policy - Privacy Policy and Cookies


© Dave Leip's Atlas of U.S. Elections, LLC 2019 All Rights Reserved