| Map | Pie | Year | Total | D | R | I | Margin | %Margin | Dem | Rep | Ind | Oth. | Dem | Rep | Ind | Other | | | | | | | | | | | | | | | | | | |
|---|
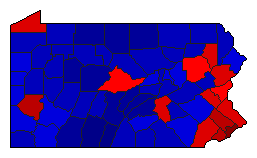 |  | 2020 |
6,806,596 |
1 |
2 |
3 |
307,641 |
4.52% |
50.85% |
46.33% |
1.77% |
1.04% |
3,461,472 |
3,153,831 |
120,489 |
70,804 |
 |  | 2016 |
5,948,335 |
1 |
2 |
0 |
165,685 |
2.79% |
51.39% |
48.61% |
0.00% |
0.00% |
3,057,010 |
2,891,325 |
0 |
0 |
 | | 2012 |
5,567,203 |
1 |
2 |
3 |
812,051 |
14.59% |
56.14% |
41.56% |
2.30% |
0.00% |
3,125,557 |
2,313,506 |
128,140 |
0 |
 | | 2008 |
5,732,574 |
2 |
1 |
0 |
383,136 |
6.68% |
45.70% |
52.38% |
0.00% |
1.92% |
2,619,791 |
3,002,927 |
0 |
109,856 |
 | | 2004 |
5,423,269 |
2 |
1 |
0 |
108,791 |
2.01% |
48.35% |
50.35% |
0.00% |
1.30% |
2,621,927 |
2,730,718 |
0 |
70,624 |
 | | 2000 |
4,619,438 |
2 |
1 |
0 |
504,109 |
10.91% |
43.10% |
54.02% |
0.00% |
2.88% |
1,991,144 |
2,495,253 |
0 |
133,041 |
 |  | 1992 |
4,594,077 |
2 |
1 |
0 |
125,605 |
2.73% |
47.62% |
50.36% |
0.00% |
2.02% |
2,187,792 |
2,313,397 |
0 |
92,888 |
 |  | 1984 |
4,601,344 |
2 |
1 |
0 |
28,543 |
0.62% |
49.10% |
49.72% |
0.00% |
1.19% |
2,259,043 |
2,287,586 |
0 |
54,715 |
 |  | 1980 |
4,227,150 |
2 |
1 |
0 |
119,539 |
2.83% |
48.16% |
50.99% |
0.00% |
0.85% |
2,035,933 |
2,155,472 |
0 |
35,745 |
|
