2020 General Election Results Comparison - Utah
| Map | Pie | Office | Total | D | R | I | Margin | %Margin | Dem | Rep | Ind | Oth. | Dem | Rep | Ind | Other |
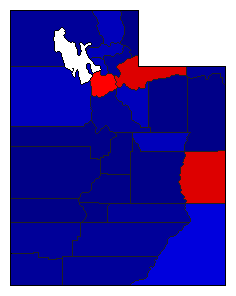
 |  | President | 1,505,982 | 2 | 1 | 8 | 304,858 | 20.24% | 37.20% | 57.45% | 0.17% | 5.18% | 560,282 | 865,140 | 2,623 | 77,937 |
 |  | Governor | 1,472,004 | 2 | 1 | 0 | 476,000 | 32.34% | 30.08% | 62.42% | 0.00% | 7.51% | 442,754 | 918,754 | 0 | 110,496 |
 |  | Attorney General | 1,450,796 | 2 | 1 | 3 | 389,354 | 26.84% | 33.74% | 60.58% | 5.68% | 0.00% | 489,499 | 878,853 | 82,444 | 0 |
Utah Results for 2020
Login
© Dave Leip's Atlas of U.S. Elections, LLC 2019 All Rights Reserved
Note: The advertisement links below may advocate political positions that this site does not endorse.
Login
© Dave Leip's Atlas of U.S. Elections, LLC 2019 All Rights Reserved
Note: The advertisement links below may advocate political positions that this site does not endorse.