| Map | Pie | Office | Total | D | R | I | Margin | %Margin | Dem | Rep | Ind | Oth. | Dem | Rep | Ind | Other | | | | | | | | | | | | | | | | | | |
|---|
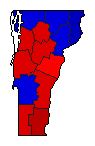
 |  | President |
367,428 |
1 |
2 |
17 |
130,116 |
35.41% |
66.09% |
30.67% |
0.03% |
3.21% |
242,820 |
112,704 |
100 |
11,804 |
 |  | US Representative |
354,837 |
1 |
2 |
3 |
142,997 |
40.30% |
67.31% |
27.01% |
2.27% |
3.41% |
238,827 |
95,830 |
8,065 |
12,115 |
 |  | Governor |
362,711 |
2 |
1 |
3 |
149,198 |
41.13% |
27.35% |
68.49% |
1.26% |
2.90% |
99,214 |
248,412 |
4,576 |
10,509 |
 | | Lt. Governor |
356,170 |
1 |
2 |
4 |
25,755 |
7.23% |
51.33% |
44.10% |
1.43% |
3.14% |
182,820 |
157,065 |
5,101 |
11,184 |
 |  | Secretary of State |
346,893 |
1 |
2 |
3 |
115,102 |
33.18% |
61.88% |
28.70% |
6.11% |
3.30% |
214,666 |
99,564 |
21,210 |
11,453 |
 |  | State Treasurer |
343,820 |
1 |
2 |
3 |
83,078 |
24.16% |
57.37% |
33.21% |
5.22% |
4.20% |
197,255 |
114,177 |
17,939 |
14,449 |
 |  | Attorney General |
345,462 |
1 |
2 |
0 |
139,189 |
40.29% |
67.76% |
27.47% |
0.00% |
4.77% |
234,081 |
94,892 |
0 |
16,489 |
 |  | Lt. Governor |
356,234 |
1 |
2 |
3 |
25,755 |
7.23% |
51.32% |
44.09% |
2.21% |
2.38% |
182,820 |
157,065 |
7,862 |
8,487 |
|
