2020 General Election Results Comparison - California
| Map | Pie | Office | Total | D | R | I | Margin | %Margin | Dem | Rep | Ind | Oth. | Dem | Rep | Ind | Other |
| President | 17,512,265 | 1 | 2 | 11 | 5,104,121 | 29.15% | 63.44% | 34.30% | 0.00% | 2.26% | 11,110,639 | 6,006,518 | 185 | 394,923 | ||
| Map | Pie | Initiative | Total Vote | N | Y | Margin | %Margin | No | Yes | Oth. | No | Yes | ||||
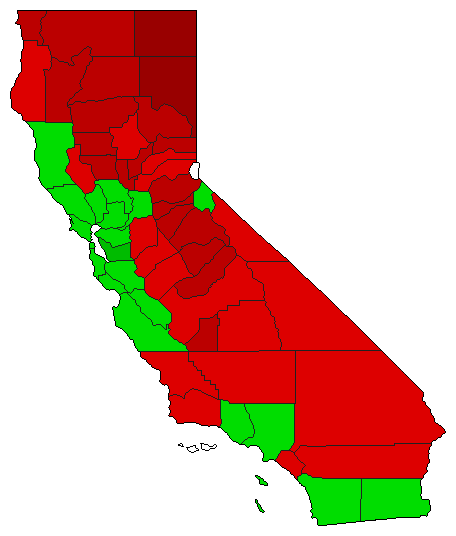 | Initiative | 16,810,772 | 2 | 0 | 1 | 366,464 | 2.18% | 48.91% | 0.00% | 51.09% | 0.00% | 8,222,154 | 0 | 8,588,618 | 0 | |
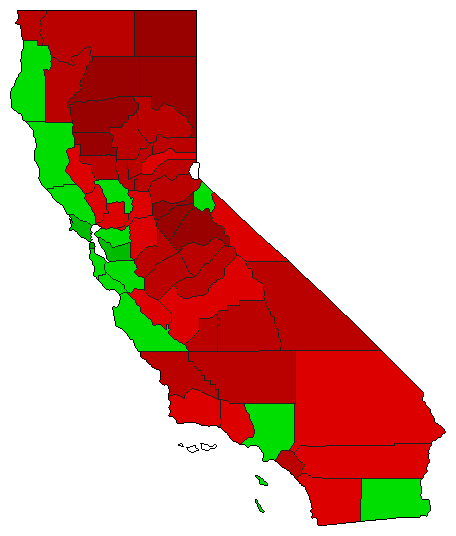 | Initiative | 17,098,623 | 1 | 0 | 2 | 672,515 | 3.93% | 51.97% | 0.00% | 48.03% | 0.00% | 8,885,569 | 0 | 8,213,054 | 0 | |
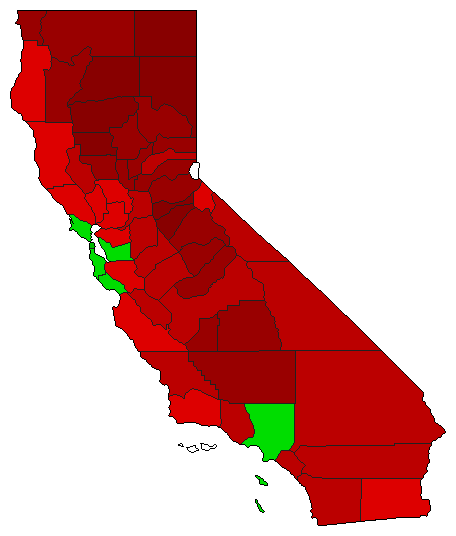 | Initiative | 16,872,659 | 1 | 0 | 2 | 2,438,531 | 14.45% | 57.23% | 0.00% | 42.77% | 0.00% | 9,655,595 | 0 | 7,217,064 | 0 | |
 | Initiative | 17,054,741 | 2 | 0 | 1 | 2,916,395 | 17.10% | 41.45% | 0.00% | 58.55% | 0.00% | 7,069,173 | 0 | 9,985,568 | 0 | |
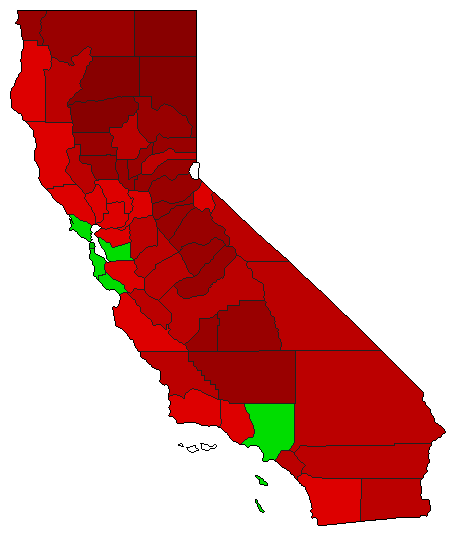 | Initiative | 17,092,124 | 1 | 0 | 2 | 2,063,490 | 12.07% | 56.04% | 0.00% | 43.96% | 0.00% | 9,577,807 | 0 | 7,514,317 | 0 | |
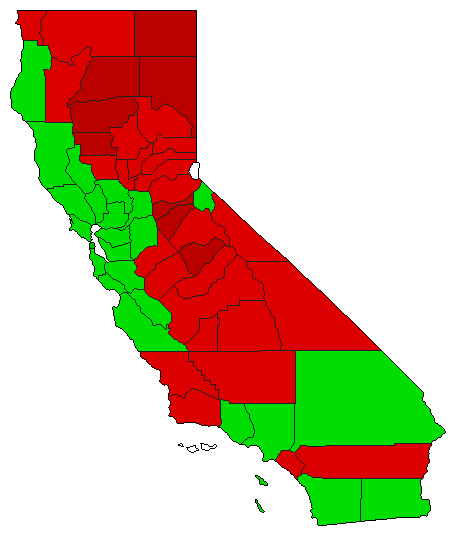 | Initiative | 16,721,923 | 2 | 0 | 1 | 369,713 | 2.21% | 48.89% | 0.00% | 51.11% | 0.00% | 8,176,105 | 0 | 8,545,818 | 0 | |
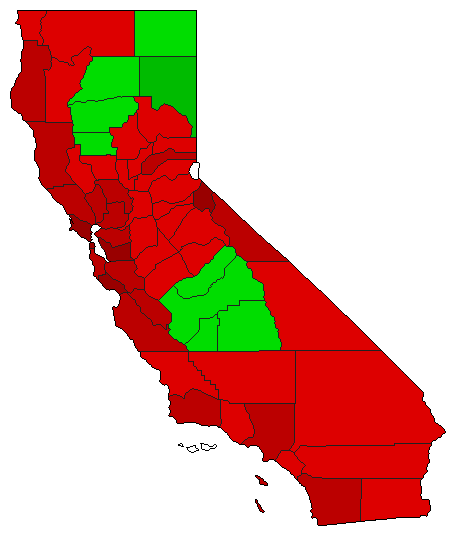 | Initiative | 16,679,897 | 1 | 0 | 2 | 3,908,219 | 23.43% | 61.72% | 0.00% | 38.28% | 0.00% | 10,294,058 | 0 | 6,385,839 | 0 | |
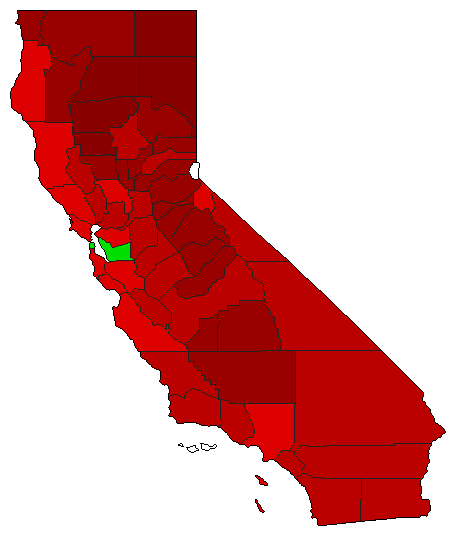 | Initiative | 16,866,504 | 1 | 0 | 2 | 3,323,908 | 19.71% | 59.85% | 0.00% | 40.15% | 0.00% | 10,095,206 | 0 | 6,771,298 | 0 | |
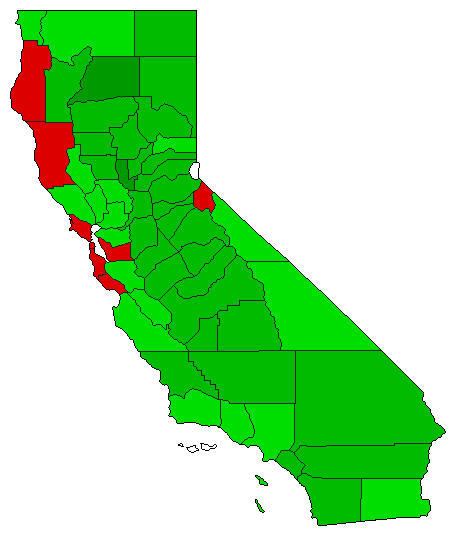 | Initiative | 16,986,245 | 2 | 0 | 1 | 2,930,605 | 17.25% | 41.37% | 0.00% | 58.63% | 0.00% | 7,027,820 | 0 | 9,958,425 | 0 | |
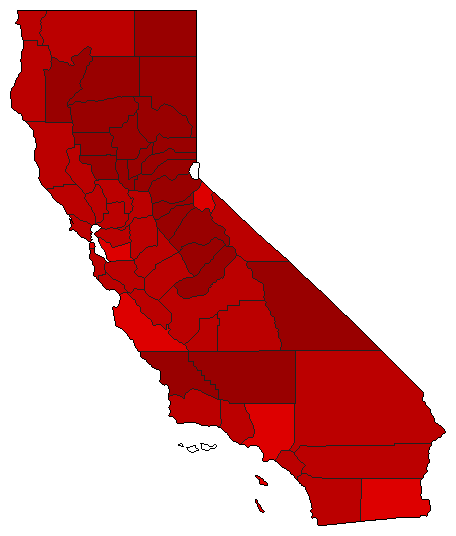 | Initiative | 16,842,628 | 1 | 0 | 2 | 4,519,714 | 26.83% | 63.42% | 0.00% | 36.58% | 0.00% | 10,681,171 | 0 | 6,161,457 | 0 | |
 | Initiative | 16,690,056 | 2 | 0 | 1 | 2,079,194 | 12.46% | 43.77% | 0.00% | 56.23% | 0.00% | 7,305,431 | 0 | 9,384,625 | 0 | |
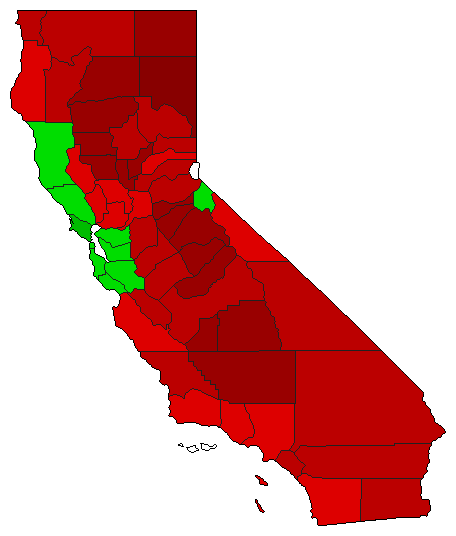 | Initiative | 16,590,606 | 1 | 0 | 2 | 2,125,846 | 12.81% | 56.41% | 0.00% | 43.59% | 0.00% | 9,358,226 | 0 | 7,232,380 | 0 | |
California Results for 2020
Login
© Dave Leip's Atlas of U.S. Elections, LLC 2019 All Rights Reserved
Note: The advertisement links below may advocate political positions that this site does not endorse.
Login
© Dave Leip's Atlas of U.S. Elections, LLC 2019 All Rights Reserved
Note: The advertisement links below may advocate political positions that this site does not endorse.