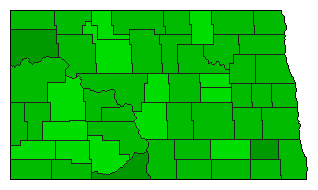
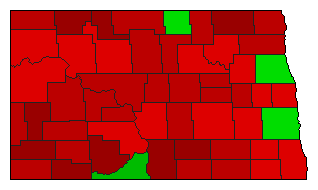
| Map | Pie | Office | Total | D | R | I | Margin | %Margin | Dem | Rep | Ind | Oth. | Dem | Rep | Ind | Other | | | | | | | | | | | | | | | | | | |
|---|
 |  | Senator |
240,140 |
2 |
1 |
3 |
75,479 |
31.43% |
24.98% |
56.41% |
18.49% |
0.11% |
59,995 |
135,474 |
44,406 |
265 |
 |  | US Representative |
238,586 |
0 |
1 |
2 |
58,755 |
24.63% |
0.00% |
62.20% |
37.57% |
0.23% |
0 |
148,399 |
89,644 |
543 |
 |  | Secretary of State |
233,828 |
2 |
1 |
3 |
83,562 |
35.74% |
27.48% |
63.22% |
9.20% |
0.10% |
64,254 |
147,816 |
21,517 |
241 |
 |  | Attorney General |
234,702 |
2 |
1 |
0 |
98,908 |
42.14% |
28.81% |
70.95% |
0.00% |
0.25% |
67,609 |
166,517 |
0 |
576 |
 |  | Agriculture Commissioner |
234,505 |
2 |
1 |
0 |
120,789 |
51.51% |
24.16% |
75.67% |
0.00% |
0.17% |
56,654 |
177,443 |
0 |
408 |
| | | Map | Pie | Initiative | Total Vote | N | | Y | Margin | %Margin | No | | Yes | Oth. | No | | Yes | |
 |  | Referendum |
237,037 |
2 |
0 |
1 |
63,689 |
26.87% |
36.57% |
0.00% |
63.43% |
0.00% |
86,674 |
0 |
150,363 |
0 |
 |  | Referendum |
238,800 |
1 |
0 |
2 |
23,584 |
9.88% |
54.94% |
0.00% |
45.06% |
0.00% |
131,192 |
0 |
107,608 |
0 |
|


