| Map | Pie | Office | Total | D | R | I | Margin | %Margin | Dem | Rep | Ind | Oth. | Dem | Rep | Ind | Other | | | | | | | | | | | | | | | | | | |
|---|
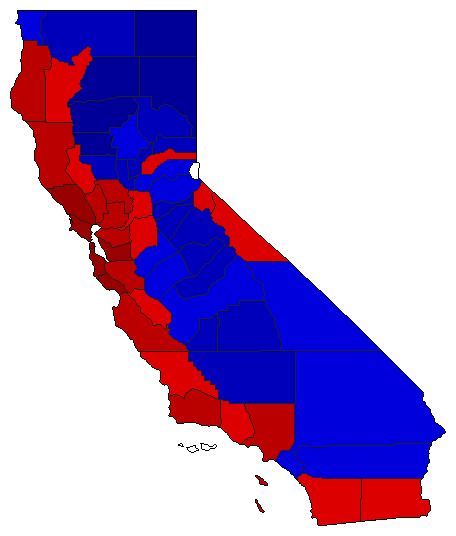
 |  | Senator |
10,843,641 |
1 |
2 |
0 |
2,399,591 |
22.13% |
61.06% |
38.94% |
0.00% |
0.00% |
6,621,616 |
4,222,025 |
0 |
0 |
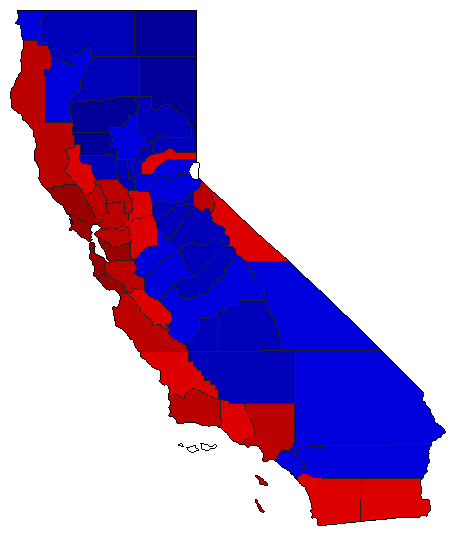
 |  | Governor |
10,933,009 |
1 |
2 |
0 |
2,007,189 |
18.36% |
59.18% |
40.82% |
0.00% |
0.00% |
6,470,099 |
4,462,910 |
0 |
0 |
 |  | Lt. Governor |
10,750,721 |
1 |
2 |
0 |
2,085,517 |
19.40% |
59.70% |
40.30% |
0.00% |
0.00% |
6,418,119 |
4,332,602 |
0 |
0 |
 |  | Secretary of State |
10,760,694 |
1 |
2 |
0 |
2,163,634 |
20.11% |
60.05% |
39.95% |
0.00% |
0.00% |
6,462,164 |
4,298,530 |
0 |
0 |
 |  | State Treasurer |
10,692,857 |
1 |
2 |
0 |
1,881,295 |
17.59% |
58.80% |
41.20% |
0.00% |
0.00% |
6,287,076 |
4,405,781 |
0 |
0 |
 |  | Attorney General |
10,729,860 |
1 |
2 |
0 |
1,949,012 |
18.16% |
59.08% |
40.92% |
0.00% |
0.00% |
6,339,436 |
4,390,424 |
0 |
0 |
 |  | Controller |
10,726,192 |
1 |
2 |
0 |
1,147,512 |
10.70% |
55.35% |
44.65% |
0.00% |
0.00% |
5,936,852 |
4,789,340 |
0 |
0 |
 |  | Insurance Commissioner |
10,605,297 |
1 |
2 |
0 |
2,106,523 |
19.86% |
59.93% |
40.07% |
0.00% |
0.00% |
6,355,910 |
4,249,387 |
0 |
0 |
| | | Map | Pie | Initiative | Total Vote | N | | Y | Margin | %Margin | No | | Yes | Oth. | No | | Yes | |
 |  | Referendum |
10,643,715 |
1 |
0 |
2 |
3,614,529 |
33.96% |
66.98% |
0.00% |
33.02% |
0.00% |
7,129,122 |
0 |
3,514,593 |
0 |
 |  | Referendum |
10,643,715 |
1 |
0 |
2 |
3,614,529 |
33.96% |
66.98% |
0.00% |
33.02% |
0.00% |
7,129,122 |
0 |
3,514,593 |
0 |
 |  | Referendum |
10,752,580 |
2 |
0 |
1 |
3,096,646 |
28.80% |
35.60% |
0.00% |
64.40% |
0.00% |
3,827,967 |
0 |
6,924,613 |
0 |
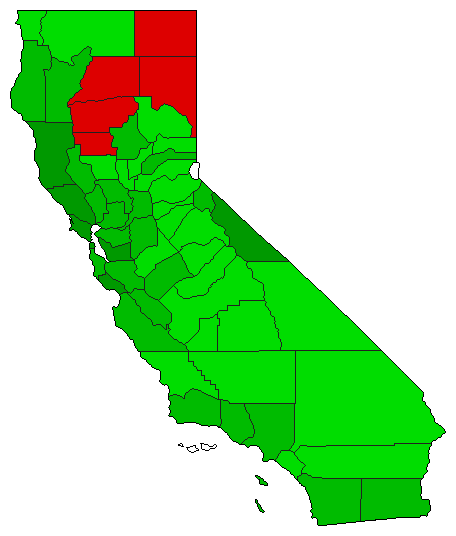
 |  | Referendum |
5,346,840 |
1 |
0 |
2 |
2,130,018 |
39.84% |
69.92% |
0.00% |
30.08% |
0.00% |
3,738,429 |
0 |
1,608,411 |
0 |
 |  | Referendum |
5,368,526 |
2 |
0 |
1 |
1,317,242 |
24.54% |
37.73% |
0.00% |
62.27% |
0.00% |
2,025,642 |
0 |
3,342,884 |
0 |
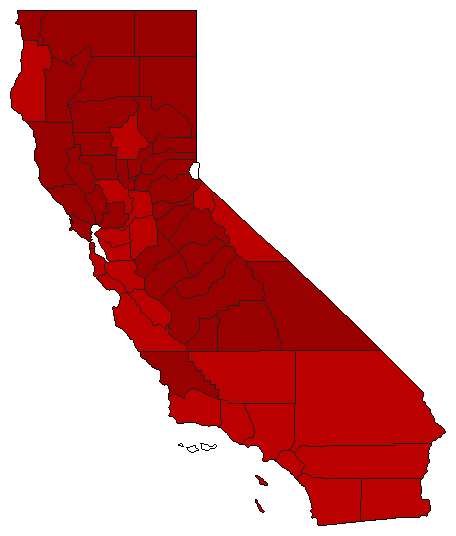
 |  | Amendment |
10,730,444 |
2 |
0 |
1 |
3,623,322 |
33.77% |
33.12% |
0.00% |
66.88% |
0.00% |
3,553,561 |
0 |
7,176,883 |
0 |
|
