2016 Representative General Election Data Graphs - Vermont
by County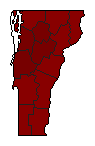
| Addison | Welch | 90.2% | |
| 0.0% | |
| 0.0% | |
| Other | 9.8% | |
| Bennington | Welch | 88.8% | |
| 0.0% | |
| 0.0% | |
| Other | 11.2% | |
| Caledonia | Welch | 87.4% | |
| 0.0% | |
| 0.0% | |
| Other | 12.6% | |
| Chittenden | Welch | 91.3% | |
| 0.0% | |
| 0.0% | |
| Other | 8.7% | |
| Essex | Welch | 83.8% | |
| 0.0% | |
| 0.0% | |
| Other | 16.2% | |
| Franklin | Welch | 88.5% | |
| 0.0% | |
| 0.0% | |
| Other | 11.5% | |
| Grand Isle | Welch | 88.2% | |
| 0.0% | |
| 0.0% | |
| Other | 11.8% | |
| Lamoille | Welch | 90.3% | |
| 0.0% | |
| 0.0% | |
| Other | 9.7% | |
| Orange | Welch | 88.5% | |
| 0.0% | |
| 0.0% | |
| Other | 11.5% | |
| Orleans | Welch | 86.4% | |
| 0.0% | |
| 0.0% | |
| Other | 13.6% | |
| Rutland | Welch | 88.2% | |
| 0.0% | |
| 0.0% | |
| Other | 11.8% | |
| Washington | Welch | 90.2% | |
| 0.0% | |
| 0.0% | |
| Other | 9.8% | |
| Windham | Welch | 89.7% | |
| 0.0% | |
| 0.0% | |
| Other | 10.3% | |
| Windsor | Welch | 89.0% | |
| 0.0% | |
| 0.0% | |
| Other | 11.0% | |