1992 Presidential General Election Data Graphs - Hawaii
by County
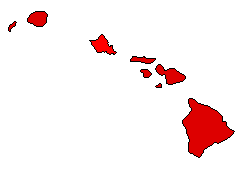
| Hawaii | Clinton | 50.5% | |
| Bush | 30.4% | ||
| Perot | 17.5% | ||
| Other | 1.7% |
| Honolulu | Clinton | 46.6% | |
| Bush | 39.1% | ||
| Perot | 13.4% | ||
| Other | 0.9% |
| Kauai | Clinton | 56.0% | |
| Bush | 32.8% | ||
| Perot | 9.2% | ||
| Other | 2.0% |
| Maui | Clinton | 51.3% | |
| Bush | 30.2% | ||
| Perot | 17.9% | ||
| Other | 0.6% |
National DataGraph for 1992 - Hawaii Results for 1992
Login
© Dave Leip's Atlas of U.S. Elections, LLC 2019 All Rights Reserved
Note: The advertisement links below may advocate political positions that this site does not endorse.
Login
© Dave Leip's Atlas of U.S. Elections, LLC 2019 All Rights Reserved
Note: The advertisement links below may advocate political positions that this site does not endorse.