2012 Presidential General Election Data Graphs - Hawaii
by County
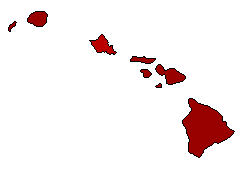
| Hawaii | Obama | 74.4% | |
| Romney | 23.2% | ||
| Other | 2.3% |
| Honolulu | Obama | 68.9% | |
| Romney | 29.8% | ||
| Other | 1.3% |
| Kauai | Obama | 73.5% | |
| Romney | 24.1% | ||
| Other | 2.4% |
| Maui | Obama | 74.1% | |
| Romney | 23.8% | ||
| Other | 2.1% |
National DataGraph for 2012 - Hawaii Results for 2012
Login
© Dave Leip's Atlas of U.S. Elections, LLC 2019 All Rights Reserved
Note: The advertisement links below may advocate political positions that this site does not endorse.
Login
© Dave Leip's Atlas of U.S. Elections, LLC 2019 All Rights Reserved
Note: The advertisement links below may advocate political positions that this site does not endorse.