2012 Presidential General Election Data Graphs - Idaho
by County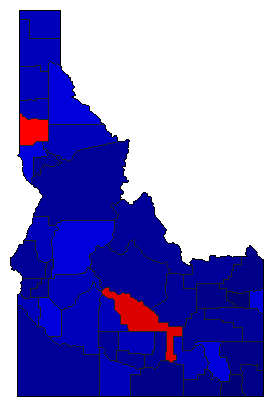
| Ada | Obama | 42.3% | |
| Romney | 53.5% | |
| Other | 4.1% | |
| Adams | Obama | 28.0% | |
| Romney | 68.6% | |
| Other | 3.4% | |
| Bannock | Obama | 37.2% | |
| Romney | 59.1% | |
| Other | 3.7% | |
| Bear Lake | Obama | 10.7% | |
| Romney | 88.2% | |
| Other | 1.1% | |
| Benewah | Obama | 30.0% | |
| Romney | 66.8% | |
| Other | 3.2% | |
| Bingham | Obama | 21.6% | |
| Romney | 76.0% | |
| Other | 2.4% | |
| Blaine | Obama | 58.8% | |
| Romney | 38.6% | |
| Other | 2.6% | |
| Boise | Obama | 30.6% | |
| Romney | 66.3% | |
| Other | 3.2% | |
| Bonner | Obama | 34.6% | |
| Romney | 60.5% | |
| Other | 5.0% | |
| Bonneville | Obama | 22.9% | |
| Romney | 74.7% | |
| Other | 2.4% | |
| Boundary | Obama | 27.0% | |
| Romney | 69.1% | |
| Other | 4.0% | |
| Butte | Obama | 20.1% | |
| Romney | 77.8% | |
| Other | 2.1% | |
| Camas | Obama | 27.5% | |
| Romney | 69.6% | |
| Other | 2.9% | |
| Canyon | Obama | 29.8% | |
| Romney | 66.5% | |
| Other | 3.8% | |
| Caribou | Obama | 12.6% | |
| Romney | 85.5% | |
| Other | 1.9% | |
| Cassia | Obama | 13.0% | |
| Romney | 84.8% | |
| Other | 2.1% | |
| Clark | Obama | 20.1% | |
| Romney | 71.6% | |
| Other | 8.2% | |
| Clearwater | Obama | 27.9% | |
| Romney | 68.8% | |
| Other | 3.3% | |
| Custer | Obama | 22.5% | |
| Romney | 74.1% | |
| Other | 3.4% | |
| Elmore | Obama | 31.4% | |
| Romney | 65.3% | |
| Other | 3.3% | |
| Franklin | Obama | 5.8% | |
| Romney | 92.8% | |
| Other | 1.4% | |
| Fremont | Obama | 14.0% | |
| Romney | 84.6% | |
| Other | 1.5% | |
| Gem | Obama | 26.1% | |
| Romney | 70.9% | |
| Other | 3.0% | |
| Gooding | Obama | 25.1% | |
| Romney | 72.2% | |
| Other | 2.6% | |
| Idaho | Obama | 21.8% | |
| Romney | 75.5% | |
| Other | 2.7% | |
| Jefferson | Obama | 11.4% | |
| Romney | 86.9% | |
| Other | 1.6% | |
| Jerome | Obama | 25.3% | |
| Romney | 71.5% | |
| Other | 3.2% | |
| Kootenai | Obama | 31.2% | |
| Romney | 65.1% | |
| Other | 3.8% | |
| Latah | Obama | 48.5% | |
| Romney | 44.3% | |
| Other | 7.2% | |
| Lemhi | Obama | 23.4% | |
| Romney | 73.7% | |
| Other | 2.9% | |
| Lewis | Obama | 24.5% | |
| Romney | 72.6% | |
| Other | 2.8% | |
| Lincoln | Obama | 28.2% | |
| Romney | 68.6% | |
| Other | 3.2% | |
| Madison | Obama | 5.8% | |
| Romney | 93.3% | |
| Other | 0.9% | |
| Minidoka | Obama | 19.9% | |
| Romney | 78.0% | |
| Other | 2.0% | |
| Nez Perce | Obama | 38.0% | |
| Romney | 58.7% | |
| Other | 3.4% | |
| Oneida | Obama | 10.4% | |
| Romney | 88.0% | |
| Other | 1.6% | |
| Owyhee | Obama | 22.4% | |
| Romney | 75.0% | |
| Other | 2.6% | |
| Payette | Obama | 26.7% | |
| Romney | 70.7% | |
| Other | 2.6% | |
| Power | Obama | 33.8% | |
| Romney | 64.4% | |
| Other | 1.8% | |
| Shoshone | Obama | 44.2% | |
| Romney | 52.4% | |
| Other | 3.3% | |
| Teton | Obama | 42.6% | |
| Romney | 54.3% | |
| Other | 3.1% | |
| Twin Falls | Obama | 26.6% | |
| Romney | 69.7% | |
| Other | 3.7% | |
| Valley | Obama | 42.6% | |
| Romney | 54.2% | |
| Other | 3.3% | |
| Washington | Obama | 25.5% | |
| Romney | 72.2% | |
| Other | 2.3% | |