1976 Presidential General Election Data Graphs - Indiana
Note: The Google advertisement links below may advocate political positions that this site does not endorse.
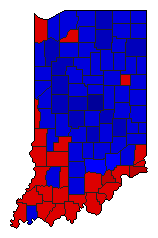
Map

AdamsCarter43.4%
 
Ford55.5%
 
Other1.0%


AllenCarter38.0%
 
Ford60.6%
 
Other1.4%


BartholomewCarter42.8%
 
Ford56.4%
 
Other0.8%


BentonCarter39.6%
 
Ford59.1%
 
Other1.3%


BlackfordCarter51.9%
 
Ford47.2%
 
Other1.0%


BooneCarter37.9%
 
Ford61.5%
 
Other0.6%


BrownCarter48.6%
 
Ford50.3%
 
Other1.2%


CarrollCarter42.5%
 
Ford56.5%
 
Other1.1%


CassCarter41.7%
 
Ford56.7%
 
Other1.5%


ClarkCarter56.1%
 
Ford42.8%
 
Other1.1%


ClayCarter48.2%
 
Ford50.4%
 
Other1.4%


ClintonCarter44.5%
 
Ford54.8%
 
Other0.7%


CrawfordCarter55.0%
 
Ford44.1%
 
Other0.9%


DaviessCarter41.8%
 
Ford57.7%
 
Other0.5%


DearbornCarter50.4%
 
Ford49.0%
 
Other0.6%


DecaturCarter43.7%
 
Ford55.6%
 
Other0.7%


DeKalbCarter43.2%
 
Ford55.2%
 
Other1.6%


DelawareCarter48.3%
 
Ford50.7%
 
Other1.0%


DuboisCarter53.2%
 
Ford46.0%
 
Other0.8%


ElkhartCarter38.7%
 
Ford60.1%
 
Other1.2%


FayetteCarter48.9%
 
Ford50.5%
 
Other0.6%


FloydCarter52.5%
 
Ford46.4%
 
Other1.0%


FountainCarter45.2%
 
Ford54.2%
 
Other0.7%


FranklinCarter47.2%
 
Ford52.0%
 
Other0.8%


FultonCarter40.1%
 
Ford58.4%
 
Other1.5%


GibsonCarter54.0%
 
Ford45.5%
 
Other0.4%


GrantCarter44.1%
 
Ford55.1%
 
Other0.8%


GreeneCarter52.5%
 
Ford46.5%
 
Other1.0%


HamiltonCarter26.2%
 
Ford72.9%
 
Other0.9%


HancockCarter37.7%
 
Ford61.3%
 
Other1.0%


HarrisonCarter53.1%
 
Ford45.9%
 
Other1.0%


HendricksCarter34.7%
 
Ford64.1%
 
Other1.2%


HenryCarter46.4%
 
Ford53.2%
 
Other0.4%


HowardCarter42.8%
 
Ford56.5%
 
Other0.8%


HuntingtonCarter41.0%
 
Ford57.8%
 
Other1.2%


JacksonCarter49.6%
 
Ford49.6%
 
Other0.9%


JasperCarter37.0%
 
Ford60.8%
 
Other2.3%


JayCarter46.8%
 
Ford52.2%
 
Other1.0%


JeffersonCarter51.7%
 
Ford46.9%
 
Other1.4%


JenningsCarter49.2%
 
Ford50.0%
 
Other0.9%


JohnsonCarter37.7%
 
Ford61.4%
 
Other1.0%


KnoxCarter51.0%
 
Ford48.3%
 
Other0.8%


KosciuskoCarter33.1%
 
Ford65.6%
 
Other1.3%


LaGrangeCarter41.9%
 
Ford57.2%
 
Other0.9%


LakeCarter56.7%
 
Ford42.4%
 
Other0.9%


LaPorteCarter44.8%
 
Ford54.1%
 
Other1.1%


LawrenceCarter45.3%
 
Ford53.2%
 
Other1.5%


MadisonCarter47.5%
 
Ford51.6%
 
Other0.9%


MarionCarter44.6%
 
Ford54.6%
 
Other0.8%


MarshallCarter39.2%
 
Ford59.2%
 
Other1.7%


MartinCarter50.8%
 
Ford48.6%
 
Other0.6%


MiamiCarter41.3%
 
Ford54.5%
 
Other4.2%


MonroeCarter46.5%
 
Ford53.1%
 
Other0.4%


MontgomeryCarter35.3%
 
Ford63.0%
 
Other1.7%


MorganCarter39.2%
 
Ford60.0%
 
Other0.8%


NewtonCarter40.8%
 
Ford58.4%
 
Other0.8%


NobleCarter45.1%
 
Ford52.9%
 
Other1.9%


OhioCarter55.6%
 
Ford43.9%
 
Other0.4%


OrangeCarter47.6%
 
Ford51.9%
 
Other0.5%


OwenCarter51.2%
 
Ford47.8%
 
Other0.9%


ParkeCarter44.2%
 
Ford55.0%
 
Other0.8%


PerryCarter57.7%
 
Ford41.9%
 
Other0.4%


PikeCarter55.5%
 
Ford44.2%
 
Other0.4%


PorterCarter38.6%
 
Ford59.8%
 
Other1.6%


PoseyCarter50.5%
 
Ford49.0%
 
Other0.5%


PulaskiCarter42.5%
 
Ford54.2%
 
Other3.3%


PutnamCarter45.3%
 
Ford53.7%
 
Other1.0%


RandolphCarter43.3%
 
Ford55.9%
 
Other0.8%


RipleyCarter47.2%
 
Ford52.1%
 
Other0.7%


RushCarter39.0%
 
Ford60.3%
 
Other0.7%


St. JosephCarter49.0%
 
Ford50.2%
 
Other0.8%


ScottCarter60.7%
 
Ford38.1%
 
Other1.1%


ShelbyCarter44.0%
 
Ford55.2%
 
Other0.8%


SpencerCarter53.3%
 
Ford46.3%
 
Other0.3%


StarkeCarter51.4%
 
Ford47.1%
 
Other1.5%


SteubenCarter38.8%
 
Ford59.2%
 
Other2.0%


SullivanCarter57.7%
 
Ford41.6%
 
Other0.7%


SwitzerlandCarter61.6%
 
Ford38.1%
 
Other0.3%


TippecanoeCarter37.5%
 
Ford61.3%
 
Other1.2%


TiptonCarter41.2%
 
Ford57.3%
 
Other1.5%


UnionCarter41.4%
 
Ford58.3%
 
Other0.3%


VanderburghCarter47.7%
 
Ford51.9%
 
Other0.4%


VermillionCarter56.1%
 
Ford43.0%
 
Other0.9%


VigoCarter50.8%
 
Ford48.5%
 
Other0.8%


WabashCarter39.8%
 
Ford59.5%
 
Other0.7%


WarrenCarter44.2%
 
Ford55.1%
 
Other0.7%


WarrickCarter51.7%
 
Ford47.7%
 
Other0.6%


WashingtonCarter53.0%
 
Ford45.6%
 
Other1.4%


WayneCarter42.2%
 
Ford57.2%
 
Other0.6%


WellsCarter42.8%
 
Ford56.3%
 
Other0.9%


WhiteCarter38.2%
 
Ford60.6%
 
Other1.1%


WhitleyCarter43.8%
 
Ford54.3%
 
Other1.9%


National DataGraph for 1976 - Indiana Results for 1976

Login

Terms of Use - DCMA Policy - Privacy Policy and Cookies


© Dave Leip's Atlas of U.S. Elections, LLC 2019 All Rights Reserved