1976 Presidential General Election Data Graphs - Kentucky
by County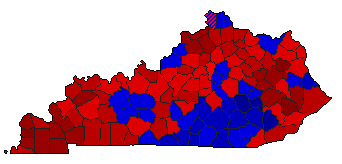
| Adair | Carter | 42.0% | |
| Ford | 56.8% | |
| Other | 1.2% | |
| Allen | Carter | 46.7% | |
| Ford | 52.5% | |
| Other | 0.8% | |
| Anderson | Carter | 57.8% | |
| Ford | 40.7% | |
| Other | 1.5% | |
| Ballard | Carter | 75.7% | |
| Ford | 17.6% | |
| Other | 6.8% | |
| Barren | Carter | 60.2% | |
| Ford | 38.9% | |
| Other | 1.0% | |
| Bath | Carter | 68.8% | |
| Ford | 30.5% | |
| Other | 0.7% | |
| Bell | Carter | 50.4% | |
| Ford | 48.0% | |
| Other | 1.6% | |
| Boone | Carter | 49.2% | |
| Ford | 49.2% | |
| Other | 1.6% | |
| Bourbon | Carter | 59.3% | |
| Ford | 38.3% | |
| Other | 2.4% | |
| Boyd | Carter | 54.5% | |
| Ford | 44.5% | |
| Other | 1.0% | |
| Boyle | Carter | 53.2% | |
| Ford | 45.6% | |
| Other | 1.3% | |
| Bracken | Carter | 63.2% | |
| Ford | 35.2% | |
| Other | 1.6% | |
| Breathitt | Carter | 77.4% | |
| Ford | 22.2% | |
| Other | 0.4% | |
| Breckinridge | Carter | 54.8% | |
| Ford | 44.1% | |
| Other | 1.1% | |
| Bullitt | Carter | 59.3% | |
| Ford | 38.4% | |
| Other | 2.3% | |
| Butler | Carter | 39.9% | |
| Ford | 59.4% | |
| Other | 0.8% | |
| Caldwell | Carter | 61.6% | |
| Ford | 36.9% | |
| Other | 1.5% | |
| Calloway | Carter | 70.7% | |
| Ford | 27.6% | |
| Other | 1.7% | |
| Campbell | Carter | 43.1% | |
| Ford | 54.8% | |
| Other | 2.1% | |
| Carlisle | Carter | 80.8% | |
| Ford | 17.7% | |
| Other | 1.5% | |
| Carroll | Carter | 72.6% | |
| Ford | 26.3% | |
| Other | 1.1% | |
| Carter | Carter | 54.9% | |
| Ford | 44.7% | |
| Other | 0.5% | |
| Casey | Carter | 31.8% | |
| Ford | 67.2% | |
| Other | 1.0% | |
| Christian | Carter | 60.7% | |
| Ford | 38.4% | |
| Other | 0.8% | |
| Clark | Carter | 58.9% | |
| Ford | 40.1% | |
| Other | 1.0% | |
| Clay | Carter | 31.4% | |
| Ford | 68.4% | |
| Other | 0.2% | |
| Clinton | Carter | 29.1% | |
| Ford | 69.5% | |
| Other | 1.4% | |
| Crittenden | Carter | 51.2% | |
| Ford | 47.6% | |
| Other | 1.2% | |
| Cumberland | Carter | 33.8% | |
| Ford | 65.4% | |
| Other | 0.8% | |
| Daviess | Carter | 51.4% | |
| Ford | 46.7% | |
| Other | 1.9% | |
| Edmonson | Carter | 41.6% | |
| Ford | 57.9% | |
| Other | 0.5% | |
| Elliott | Carter | 80.7% | |
| Ford | 18.5% | |
| Other | 0.8% | |
| Estill | Carter | 47.1% | |
| Ford | 52.2% | |
| Other | 0.7% | |
| Fayette | Carter | 43.1% | |
| Ford | 54.1% | |
| Other | 2.8% | |
| Fleming | Carter | 58.2% | |
| Ford | 41.4% | |
| Other | 0.5% | |
| Floyd | Carter | 76.1% | |
| Ford | 23.3% | |
| Other | 0.6% | |
| Franklin | Carter | 63.7% | |
| Ford | 33.7% | |
| Other | 2.6% | |
| Fulton | Carter | 68.3% | |
| Ford | 30.5% | |
| Other | 1.2% | |
| Gallatin | Carter | 71.7% | |
| Ford | 26.9% | |
| Other | 1.4% | |
| Garrard | Carter | 47.3% | |
| Ford | 51.3% | |
| Other | 1.4% | |
| Grant | Carter | 64.3% | |
| Ford | 33.4% | |
| Other | 2.4% | |
| Graves | Carter | 72.3% | |
| Ford | 25.7% | |
| Other | 2.0% | |
| Grayson | Carter | 45.1% | |
| Ford | 53.9% | |
| Other | 1.0% | |
| Green | Carter | 46.1% | |
| Ford | 53.0% | |
| Other | 0.8% | |
| Greenup | Carter | 57.3% | |
| Ford | 42.1% | |
| Other | 0.6% | |
| Hancock | Carter | 56.9% | |
| Ford | 40.9% | |
| Other | 2.2% | |
| Hardin | Carter | 52.5% | |
| Ford | 45.9% | |
| Other | 1.6% | |
| Harlan | Carter | 60.8% | |
| Ford | 38.5% | |
| Other | 0.7% | |
| Harrison | Carter | 64.5% | |
| Ford | 34.4% | |
| Other | 1.0% | |
| Hart | Carter | 60.8% | |
| Ford | 38.4% | |
| Other | 0.8% | |
| Henderson | Carter | 65.3% | |
| Ford | 33.4% | |
| Other | 1.2% | |
| Henry | Carter | 70.7% | |
| Ford | 28.2% | |
| Other | 1.0% | |
| Hickman | Carter | 74.9% | |
| Ford | 21.5% | |
| Other | 3.5% | |
| Hopkins | Carter | 59.7% | |
| Ford | 39.4% | |
| Other | 1.0% | |
| Jackson | Carter | 19.6% | |
| Ford | 79.8% | |
| Other | 0.6% | |
| Jefferson | Carter | 47.3% | |
| Ford | 50.2% | |
| Other | 2.5% | |
| Jessamine | Carter | 46.6% | |
| Ford | 51.3% | |
| Other | 2.1% | |
| Johnson | Carter | 42.7% | |
| Ford | 56.6% | |
| Other | 0.7% | |
| Kenton | Carter | 45.2% | |
| Ford | 53.0% | |
| Other | 1.8% | |
| Knott | Carter | 82.4% | |
| Ford | 16.6% | |
| Other | 1.0% | |
| Knox | Carter | 42.1% | |
| Ford | 56.9% | |
| Other | 1.0% | |
| Larue | Carter | 60.4% | |
| Ford | 38.5% | |
| Other | 1.1% | |
| Laurel | Carter | 37.9% | |
| Ford | 61.4% | |
| Other | 0.7% | |
| Lawrence | Carter | 56.1% | |
| Ford | 42.9% | |
| Other | 1.0% | |
| Lee | Carter | 42.6% | |
| Ford | 56.5% | |
| Other | 0.9% | |
| Leslie | Carter | 28.0% | |
| Ford | 71.5% | |
| Other | 0.4% | |
| Letcher | Carter | 59.2% | |
| Ford | 40.3% | |
| Other | 0.5% | |
| Lewis | Carter | 44.5% | |
| Ford | 55.0% | |
| Other | 0.5% | |
| Lincoln | Carter | 54.0% | |
| Ford | 45.5% | |
| Other | 0.6% | |
| Livingston | Carter | 73.1% | |
| Ford | 25.7% | |
| Other | 1.2% | |
| Logan | Carter | 65.6% | |
| Ford | 32.9% | |
| Other | 1.5% | |
| Lyon | Carter | 72.3% | |
| Ford | 26.3% | |
| Other | 1.4% | |
| McCracken | Carter | 65.9% | |
| Ford | 30.8% | |
| Other | 3.2% | |
| McCreary | Carter | 35.5% | |
| Ford | 63.6% | |
| Other | 0.8% | |
| McLean | Carter | 65.3% | |
| Ford | 33.7% | |
| Other | 1.0% | |
| Madison | Carter | 51.7% | |
| Ford | 46.6% | |
| Other | 1.7% | |
| Magoffin | Carter | 57.5% | |
| Ford | 42.1% | |
| Other | 0.4% | |
| Marion | Carter | 66.1% | |
| Ford | 32.4% | |
| Other | 1.5% | |
| Marshall | Carter | 71.8% | |
| Ford | 26.8% | |
| Other | 1.4% | |
| Martin | Carter | 37.1% | |
| Ford | 62.1% | |
| Other | 0.8% | |
| Mason | Carter | 56.6% | |
| Ford | 42.1% | |
| Other | 1.3% | |
| Meade | Carter | 62.2% | |
| Ford | 36.1% | |
| Other | 1.7% | |
| Menifee | Carter | 76.8% | |
| Ford | 22.4% | |
| Other | 0.8% | |
| Mercer | Carter | 56.9% | |
| Ford | 40.9% | |
| Other | 2.2% | |
| Metcalfe | Carter | 57.5% | |
| Ford | 41.5% | |
| Other | 1.0% | |
| Monroe | Carter | 29.4% | |
| Ford | 69.9% | |
| Other | 0.6% | |
| Montgomery | Carter | 60.0% | |
| Ford | 38.8% | |
| Other | 1.2% | |
| Morgan | Carter | 74.3% | |
| Ford | 25.0% | |
| Other | 0.7% | |
| Muhlenberg | Carter | 61.6% | |
| Ford | 37.5% | |
| Other | 0.9% | |
| Nelson | Carter | 59.4% | |
| Ford | 37.4% | |
| Other | 3.3% | |
| Nicholas | Carter | 66.5% | |
| Ford | 31.0% | |
| Other | 2.4% | |
| Ohio | Carter | 47.8% | |
| Ford | 51.3% | |
| Other | 0.9% | |
| Oldham | Carter | 42.5% | |
| Ford | 55.7% | |
| Other | 1.8% | |
| Owen | Carter | 76.4% | |
| Ford | 22.2% | |
| Other | 1.4% | |
| Owsley | Carter | 22.3% | |
| Ford | 77.0% | |
| Other | 0.7% | |
| Pendleton | Carter | 62.6% | |
| Ford | 35.9% | |
| Other | 1.5% | |
| Perry | Carter | 55.7% | |
| Ford | 43.8% | |
| Other | 0.5% | |
| Pike | Carter | 60.4% | |
| Ford | 38.7% | |
| Other | 0.8% | |
| Powell | Carter | 61.4% | |
| Ford | 37.9% | |
| Other | 0.7% | |
| Pulaski | Carter | 38.1% | |
| Ford | 61.2% | |
| Other | 0.7% | |
| Robertson | Carter | 65.9% | |
| Ford | 33.2% | |
| Other | 0.8% | |
| Rockcastle | Carter | 35.1% | |
| Ford | 64.4% | |
| Other | 0.5% | |
| Rowan | Carter | 60.3% | |
| Ford | 38.2% | |
| Other | 1.4% | |
| Russell | Carter | 38.1% | |
| Ford | 60.9% | |
| Other | 1.0% | |
| Scott | Carter | 55.3% | |
| Ford | 42.7% | |
| Other | 2.0% | |
| Shelby | Carter | 56.1% | |
| Ford | 42.6% | |
| Other | 1.3% | |
| Simpson | Carter | 64.7% | |
| Ford | 34.4% | |
| Other | 0.8% | |
| Spencer | Carter | 61.0% | |
| Ford | 37.4% | |
| Other | 1.6% | |
| Taylor | Carter | 50.3% | |
| Ford | 48.6% | |
| Other | 1.1% | |
| Todd | Carter | 67.7% | |
| Ford | 30.4% | |
| Other | 1.8% | |
| Trigg | Carter | 72.8% | |
| Ford | 26.5% | |
| Other | 0.7% | |
| Trimble | Carter | 74.2% | |
| Ford | 24.5% | |
| Other | 1.3% | |
| Union | Carter | 66.6% | |
| Ford | 32.3% | |
| Other | 1.1% | |
| Warren | Carter | 50.1% | |
| Ford | 48.9% | |
| Other | 1.0% | |
| Washington | Carter | 56.1% | |
| Ford | 41.7% | |
| Other | 2.2% | |
| Wayne | Carter | 43.6% | |
| Ford | 55.8% | |
| Other | 0.6% | |
| Webster | Carter | 70.9% | |
| Ford | 28.2% | |
| Other | 0.9% | |
| Whitley | Carter | 40.5% | |
| Ford | 58.7% | |
| Other | 0.8% | |
| Wolfe | Carter | 72.3% | |
| Ford | 26.8% | |
| Other | 0.9% | |
| Woodford | Carter | 49.2% | |
| Ford | 48.4% | |
| Other | 2.4% | |