2000 Presidential General Election Data Graphs - Maryland
by County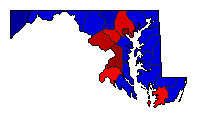
| Allegany | Gore | 41.3% | |
| Bush | 55.6% | |
| Nader | 2.3% | |
| Other | 0.8% | |
| Anne Arundel | Gore | 44.7% | |
| Bush | 51.9% | |
| Nader | 2.7% | |
| Other | 0.7% | |
| Baltimore | Gore | 52.8% | |
| Bush | 43.7% | |
| Nader | 2.8% | |
| Other | 0.6% | |
| Calvert | Gore | 43.6% | |
| Bush | 53.7% | |
| Nader | 2.2% | |
| Other | 0.5% | |
| Caroline | Gore | 37.9% | |
| Bush | 59.2% | |
| Nader | 2.2% | |
| Other | 0.6% | |
| Carroll | Gore | 31.5% | |
| Bush | 65.2% | |
| Nader | 2.6% | |
| Other | 0.7% | |
| Cecil | Gore | 42.7% | |
| Bush | 53.7% | |
| Nader | 2.7% | |
| Other | 0.9% | |
| Charles | Gore | 49.1% | |
| Bush | 48.8% | |
| Nader | 1.7% | |
| Other | 0.4% | |
| Dorchester | Gore | 45.9% | |
| Bush | 51.3% | |
| Nader | 1.9% | |
| Other | 0.8% | |
| Frederick | Gore | 39.1% | |
| Bush | 57.7% | |
| Nader | 2.6% | |
| Other | 0.7% | |
| Garrett | Gore | 27.0% | |
| Bush | 70.5% | |
| Nader | 1.9% | |
| Other | 0.6% | |
| Harford | Gore | 39.0% | |
| Bush | 57.8% | |
| Nader | 2.5% | |
| Other | 0.7% | |
| Howard | Gore | 51.9% | |
| Bush | 44.2% | |
| Nader | 3.2% | |
| Other | 0.7% | |
| Kent | Gore | 44.9% | |
| Bush | 51.4% | |
| Nader | 3.3% | |
| Other | 0.4% | |
| Montgomery | Gore | 62.5% | |
| Bush | 33.5% | |
| Nader | 3.4% | |
| Other | 0.6% | |
| Prince George's | Gore | 79.5% | |
| Bush | 18.4% | |
| Nader | 1.7% | |
| Other | 0.5% | |
| Queen Anne's | Gore | 37.3% | |
| Bush | 59.5% | |
| Nader | 2.7% | |
| Other | 0.5% | |
| St. Mary's | Gore | 40.4% | |
| Bush | 57.1% | |
| Nader | 1.9% | |
| Other | 0.6% | |
| Somerset | Gore | 49.8% | |
| Bush | 47.5% | |
| Nader | 1.9% | |
| Other | 0.9% | |
| Talbot | Gore | 38.4% | |
| Bush | 58.3% | |
| Nader | 2.8% | |
| Other | 0.5% | |
| Washington | Gore | 38.4% | |
| Bush | 58.9% | |
| Nader | 2.2% | |
| Other | 0.6% | |
| Wicomico | Gore | 45.5% | |
| Bush | 51.4% | |
| Nader | 2.4% | |
| Other | 0.7% | |
| Worcester | Gore | 45.2% | |
| Bush | 51.8% | |
| Nader | 2.3% | |
| Other | 0.7% | |
City| Baltimore | Gore | 82.5% | |
| Bush | 14.1% | |
| Nader | 2.9% | |
| Other | 0.5% | |