2008 Presidential General Election Data Graphs - Maryland
by County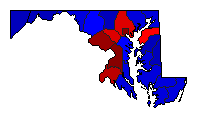
| Allegany | Obama | 36.0% | |
| McCain | 61.9% | |
| Other | 2.2% | |
| Anne Arundel | Obama | 48.2% | |
| McCain | 50.0% | |
| Other | 1.9% | |
| Baltimore | Obama | 56.2% | |
| McCain | 41.7% | |
| Other | 2.1% | |
| Calvert | Obama | 46.1% | |
| McCain | 52.4% | |
| Other | 1.5% | |
| Caroline | Obama | 37.6% | |
| McCain | 60.6% | |
| Other | 1.8% | |
| Carroll | Obama | 33.1% | |
| McCain | 64.3% | |
| Other | 2.6% | |
| Cecil | Obama | 41.6% | |
| McCain | 56.1% | |
| Other | 2.3% | |
| Charles | Obama | 62.2% | |
| McCain | 36.7% | |
| Other | 1.1% | |
| Dorchester | Obama | 45.3% | |
| McCain | 53.5% | |
| Other | 1.3% | |
| Frederick | Obama | 48.6% | |
| McCain | 49.6% | |
| Other | 1.8% | |
| Garrett | Obama | 29.0% | |
| McCain | 69.2% | |
| Other | 1.8% | |
| Harford | Obama | 39.4% | |
| McCain | 58.2% | |
| Other | 2.4% | |
| Howard | Obama | 60.0% | |
| McCain | 38.1% | |
| Other | 1.9% | |
| Kent | Obama | 49.4% | |
| McCain | 49.0% | |
| Other | 1.6% | |
| Montgomery | Obama | 71.6% | |
| McCain | 27.0% | |
| Other | 1.4% | |
| Prince George's | Obama | 88.9% | |
| McCain | 10.4% | |
| Other | 0.7% | |
| Queen Anne's | Obama | 35.7% | |
| McCain | 62.7% | |
| Other | 1.6% | |
| St. Mary's | Obama | 42.8% | |
| McCain | 55.6% | |
| Other | 1.5% | |
| Somerset | Obama | 48.2% | |
| McCain | 50.8% | |
| Other | 1.1% | |
| Talbot | Obama | 44.4% | |
| McCain | 54.1% | |
| Other | 1.5% | |
| Washington | Obama | 42.6% | |
| McCain | 55.5% | |
| Other | 1.9% | |
| Wicomico | Obama | 46.4% | |
| McCain | 52.2% | |
| Other | 1.4% | |
| Worcester | Obama | 41.6% | |
| McCain | 57.1% | |
| Other | 1.3% | |
City| Baltimore | Obama | 87.2% | |
| McCain | 11.7% | |
| Other | 1.2% | |