1962 Secretary of State General Election Data Graphs - Massachusetts
by CountyData for this Contest was Contributed by on 2013-12-28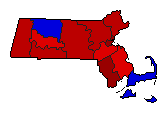
| Barnstable | White | 41.5% | |
| Reynolds | 58.0% | |
| Other | 0.6% | |
| Berkshire | White | 61.9% | |
| Reynolds | 37.1% | |
| Other | 1.0% | |
| Bristol | White | 71.5% | |
| Reynolds | 27.8% | |
| Other | 0.7% | |
| Dukes | White | 45.9% | |
| Reynolds | 53.5% | |
| Other | 0.7% | |
| Essex | White | 62.4% | |
| Reynolds | 36.9% | |
| Other | 0.8% | |
| Franklin | White | 48.7% | |
| Reynolds | 50.4% | |
| Other | 0.9% | |
| Hampden | White | 61.1% | |
| Reynolds | 37.6% | |
| Other | 1.3% | |
| Hampshire | White | 59.9% | |
| Reynolds | 39.5% | |
| Other | 0.7% | |
| Middlesex | White | 61.4% | |
| Reynolds | 37.9% | |
| Other | 0.7% | |
| Nantucket | White | 40.9% | |
| Reynolds | 58.8% | |
| Other | 0.3% | |
| Norfolk | White | 56.4% | |
| Reynolds | 43.1% | |
| Other | 0.5% | |
| Plymouth | White | 53.7% | |
| Reynolds | 45.7% | |
| Other | 0.6% | |
| Suffolk | White | 78.8% | |
| Reynolds | 19.7% | |
| Other | 1.5% | |
| Worcester | White | 63.3% | |
| Reynolds | 36.0% | |
| Other | 0.7% | |