1986 State Auditor General Election Data Graphs - Massachusetts
by CountyData for this Contest was Contributed by on 2016-09-28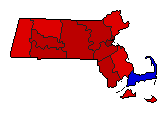
| Barnstable | DeNucci | 48.8% | |
| Robinston | 51.2% | |
| Other | 0.0% | |
| Berkshire | DeNucci | 58.1% | |
| Robinston | 41.9% | |
| Other | 0.0% | |
| Bristol | DeNucci | 66.3% | |
| Robinston | 33.7% | |
| Other | 0.0% | |
| Dukes | DeNucci | 58.7% | |
| Robinston | 41.3% | |
| Essex | DeNucci | 59.5% | |
| Robinston | 40.5% | |
| Other | 0.0% | |
| Franklin | DeNucci | 57.0% | |
| Robinston | 43.0% | |
| Hampden | DeNucci | 65.2% | |
| Robinston | 34.8% | |
| Other | 0.0% | |
| Hampshire | DeNucci | 66.0% | |
| Robinston | 34.0% | |
| Other | 0.0% | |
| Middlesex | DeNucci | 64.0% | |
| Robinston | 36.0% | |
| Other | 0.0% | |
| Nantucket | DeNucci | 55.0% | |
| Robinston | 45.0% | |
| Norfolk | DeNucci | 63.2% | |
| Robinston | 36.8% | |
| Other | 0.0% | |
| Plymouth | DeNucci | 57.3% | |
| Robinston | 42.7% | |
| Other | 0.0% | |
| Suffolk | DeNucci | 76.8% | |
| Robinston | 23.2% | |
| Other | 0.0% | |
| Worcester | DeNucci | 61.9% | |
| Robinston | 38.1% | |
| Other | 0.0% | |